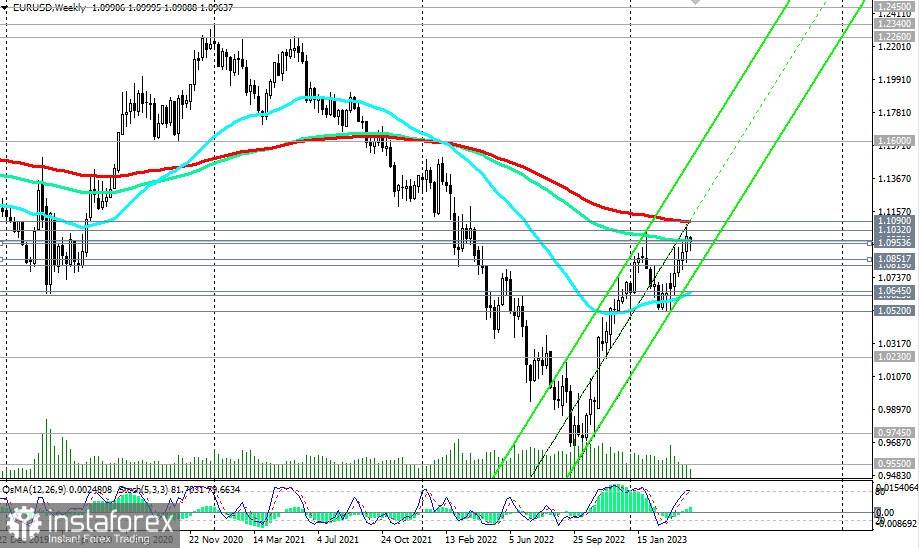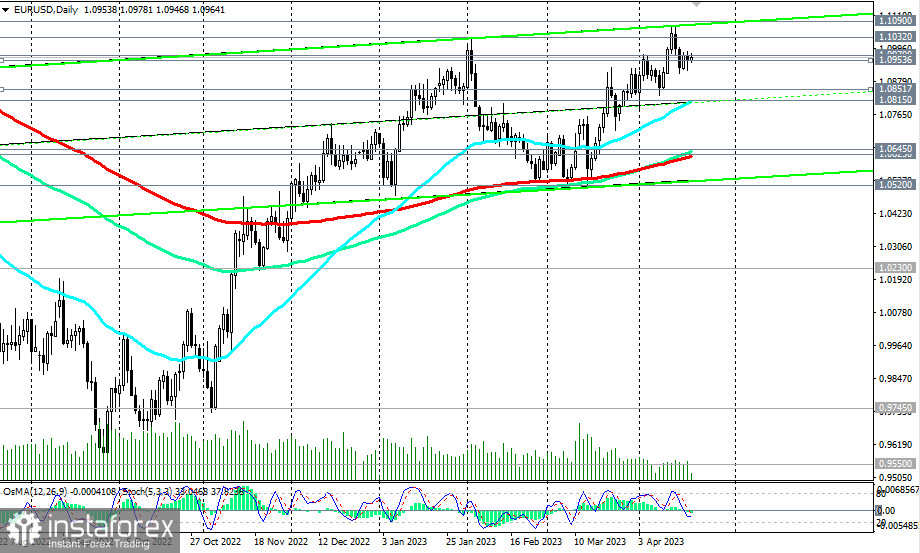
EUR/USD is trying to consolidate above the important long-term support at 1.0970 (144 EMA on the weekly chart), maintaining a positive momentum, fueled, among other things, by the narrowing interest rate differentials in the United States and Eurozone, 5.00% and 3.50% respectively, at the moment.
Some of the leaders of the U.S. Central Bank believe that it is necessary to suspend the cycle of tightening monetary policy due to the risks of increasing pressure on the banking sector and the economy as a whole, which will eventually lead to at least a recession. At the same time, the majority of the ECB management believes that it is necessary to continue tightening monetary stimulus and again raise the interest rate by 50 basis points at the May meeting of the bank. Even based on this fundamental factor, the conclusion suggests the necessity to buy a rising euro at the expense of a falling dollar.

Overall, the bullish momentum remains, and there is very little left for the EUR/USD to break into the long-term bull market zone. For this, the pair needs to overcome the 1.1090 mark and then consolidate there (the key long-term resistance level of 200 EMA on the weekly chart passes through 1.1090).
Below this key resistance level, EUR/USD still remains in the global downward trend zone, and only a breakdown of the 1.1600 resistance level (200 EMA on the monthly chart) will bring EUR/USD into the global bull market zone.
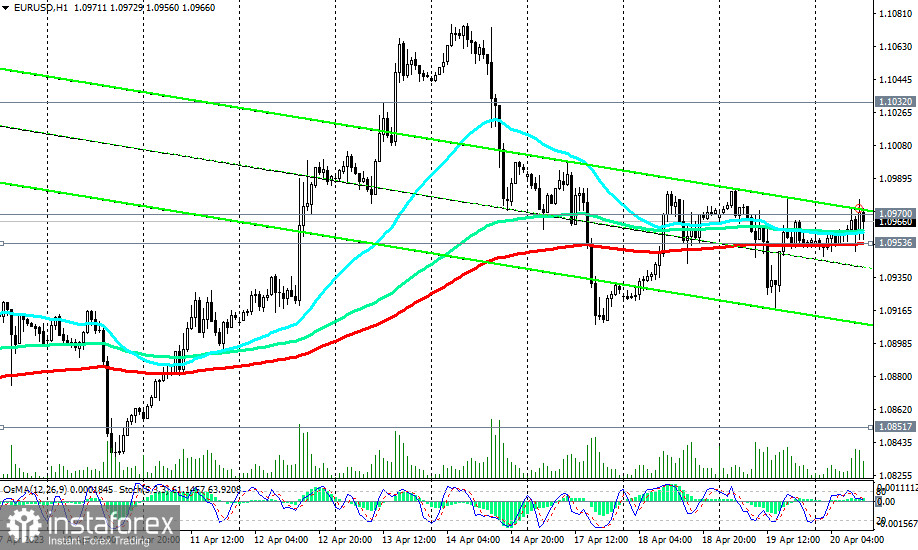
A signal to buy today could be a breakdown of the local and intra-week high of 1.1000.

In an alternative scenario, a rebound will occur near the 1.1090 resistance level, and a sequential breakdown of support levels 1.0970 (144 EMA on the weekly chart), 1.0953 (200 EMA on the 1-hour chart), 1.0910 (intraday low) could signal a resumption of short positions with the prospect of a decline to support levels 1.0625 (200 EMA on the daily chart), 1.0520 (local support level).
In the meantime, long positions are preferable, despite the apparent overbought of the pair.
Support levels: 1.0970, 1.0953, 1.0910, 1.0852, 1.0815, 1.0800, 1.0645, 1.0625, 1.0600, 1.0520
Resistance levels: 1.1000, 1.1032, 1.1090, 1.1200, 1.1600
 English
 Русский
 Bahasa Indonesia
 Bahasa Malay
 ไทย
ไทย Español
 Deutsch
 Български
 Français
 Tiếng Việt
 中文
中文 বাংলা
বাংলা हिन्दी
 Čeština
 Українська
 Română

