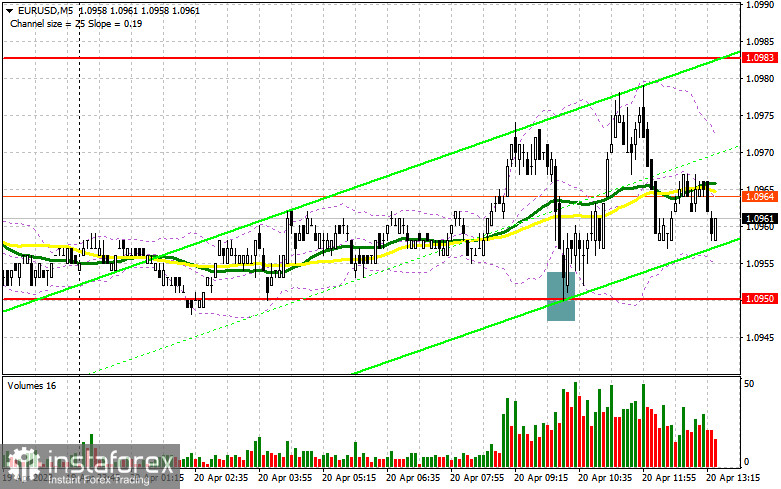
In my morning forecast, I called attention to the 1.0950 level and recommended making market entry decisions based on it. Let's look at the 5-minute chart and figure out what happened there. The decline and formation of a false breakout led to a buy signal, after which the euro went up about 20 points, but we did not reach the nearest resistance of 1.0983. The technical picture for the second half of the day needed to be revised, and the strategy itself needed to be revised.

To open long positions for EURUSD, it is necessary:
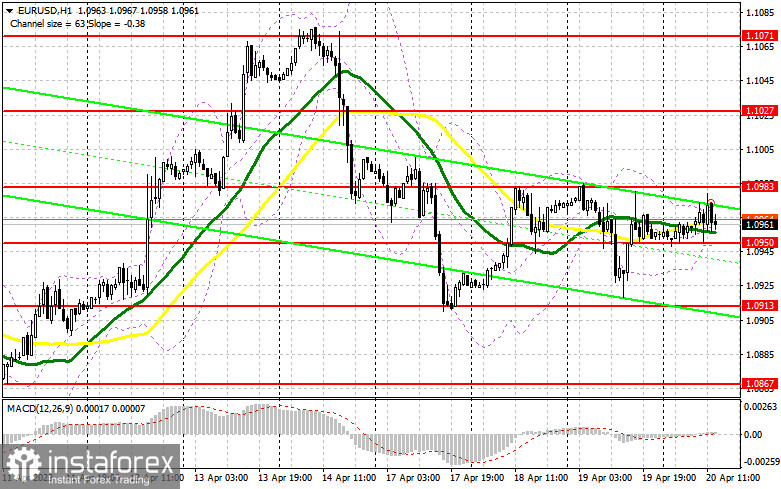
The market may react to the data on the number of initial jobless claims and home sales volume in the US secondary market, but everything will likely remain within the channel. There is also no particular sense in relying on FOMC members Christopher Waller and Michelle Bowman's speeches, as hawkish statements have already been sounding this week from Fed representatives. I did not see any significant reaction from traders to them. If pressure on the pair returns, it would be good to see more buyers around the middle of the channel at 1.0950, similar to what I analyzed above. The moving averages are also playing on the bulls' side. The formation of a false breakout at this level will lead to a buy signal and growth to the nearest resistance of 1.0983, which we did not reach in the first half of the day. A break and top-down test of this range will strengthen buyers' confidence, returning to the ascending trend and creating an additional entry point for building long positions with the update of the next resistance at 1.1027. The ultimate goal remains the area of 1.1071, where I will fix profits. In the case of a decline in EUR/USD and the absence of buyers at 1.0950 in the second half of the day, which can also happen since this level has already been tested during the European session, pressure on the euro will increase. Then, only the formation of a false breakout in the area of the lower border of 1.0913 will give a signal to buy the euro. I will open long positions immediately on the rebound from the minimum of 1.0867, with a target of an upward correction of 30-35 points within the day.
To open short positions for EURUSD, it is necessary:
Sellers tried to take control of the market, but nothing worked out. An important task for the second half of the day is to defend the resistance of 1.0983, which we didn't reach yesterday by just a few points. And since bears couldn't break below 1.0950, it's time for bulls to try to break above 1.0983 in the second half of the day. A false breakout at this level will signal a sell-off, possibly returning the pair to 1.0950, where the moving averages are playing on the buyers' side. Consolidation below this range against the backdrop of strong US labor market and housing market data, as well as a reverse test from bottom to top, is a direct path to 1.0913. The ultimate target will be a new weekly low of 1.0867, where profits will be fixed. In case of an upward movement in EUR/USD during the American session and the absence of bears at 1.0983, which is also likely, deferring short positions to the 1.1027 level. Selling is also possible only after unsuccessful consolidation. I will open short positions immediately on a rebound from the maximum of 1.1071 with a target of a downward correction of 30-35 points.


Indicator signals:
Moving averages
Trading is being conducted above the 30 and 50-day moving averages, indicating an attempt by bulls to seize the initiative.
Note: The author considers the period and prices of moving averages on the hourly chart H1 and differ from the general definition of classic daily moving averages on the daily chart D1.
Bollinger Bands
In the case of growth, the upper boundary of the indicator will act as resistance at around 1.0970.
Description of indicators:
• Moving average (determines the current trend by smoothing volatility and noise). Period 50. Marked in yellow on the chart.
• Moving average (determines the current trend by smoothing volatility and noise). Period 30. Marked in green on the chart.
• MACD indicator (Moving Average Convergence/Divergence - convergence/divergence of moving averages) Fast EMA period 12. Slow EMA period 26. SMA period 9
• Bollinger Bands. Period 20
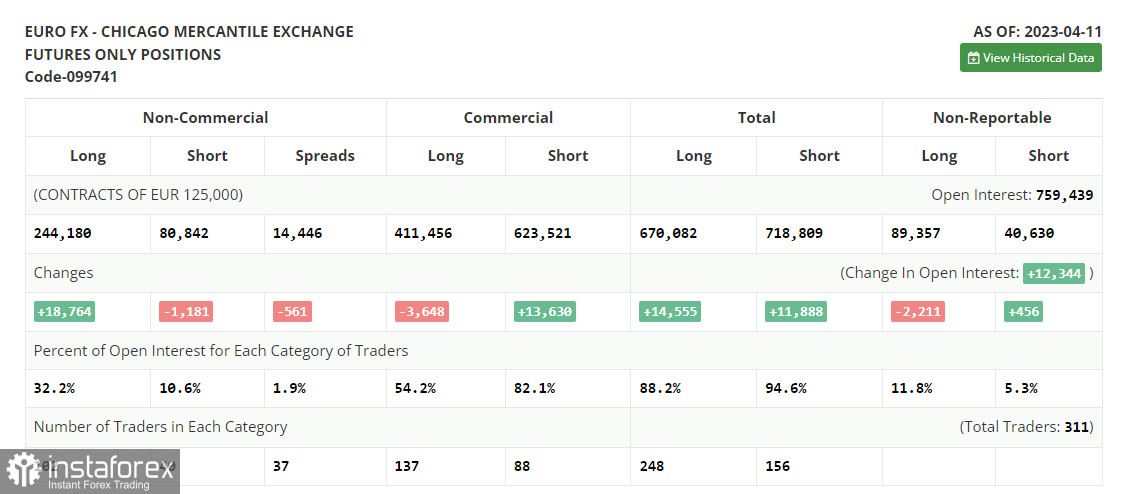
• Non-commercial traders - speculators, such as individual traders, hedge funds, and large institutions, using the futures market for speculative purposes and meeting certain requirements.
• Long non-commercial positions represent the total long open position of non-commercial traders.
• Short non-commercial positions represent the total short open position of non-commercial traders.
• Total non-commercial net position is the difference between short and long positions of non-commercial traders.
 English
 Русский
 Bahasa Indonesia
 Bahasa Malay
 ไทย
ไทย Español
 Deutsch
 Български
 Français
 Tiếng Việt
 中文
中文 বাংলা
বাংলা हिन्दी
 Čeština
 Українська
 Română

