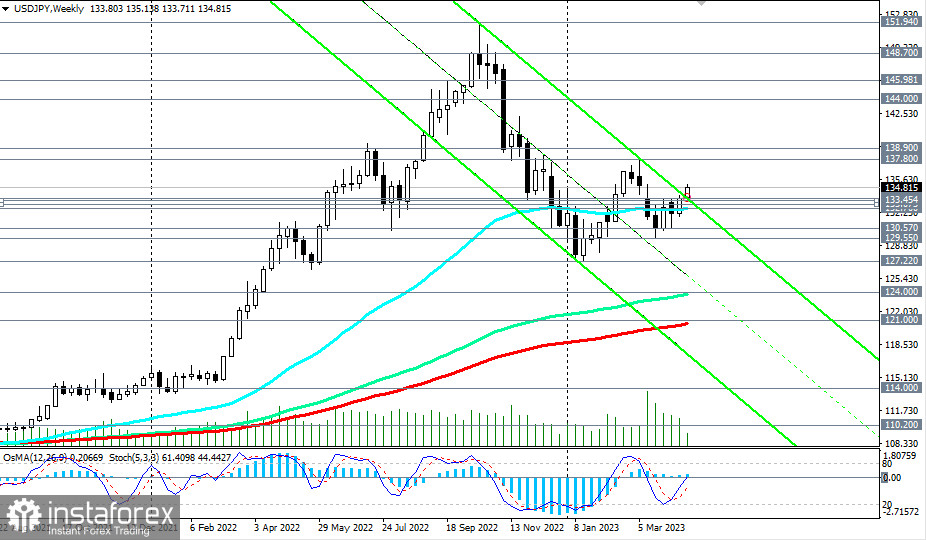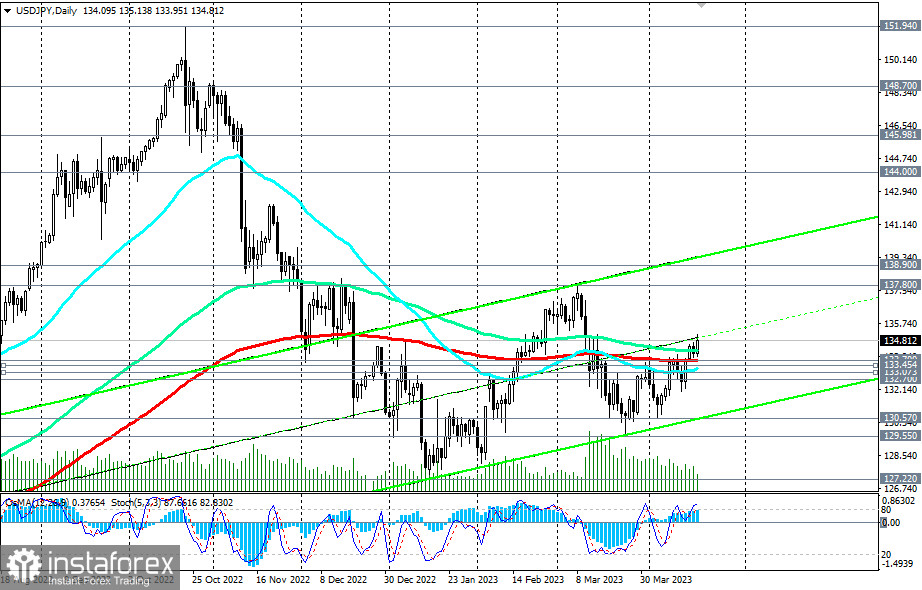
USD/JPY is rising for the second week in a row today, trying to gain a foothold in the medium-term bull market zone, above the key support level 133.70 (200 EMA on the daily chart). Above the key support levels 124.00 (144 EMA on the weekly chart), 121.00 (200 EMA on the weekly chart), the pair is trading in the zone of long-term and global bull markets. In this situation, long positions remain preferable—it is better to enter them after a pullback to support levels, as we also noted.

In this case, we can talk about the zone of strong support levels 133.70, 133.45 (200 EMA on the 1-hour chart), 133.07 (200 EMA on the 4-hour chart), 132.70 (50 EMA on the weekly chart).
It may also be relevant to enter on a buy-stop order located above today's high at 135.13.
In an alternative scenario, the price will break through the mentioned support levels and head inside the downward channel on the weekly chart, towards the local support level and the year's low at 127.22. If the decline continues, breaking through the key support levels 124.00, 121.00 will lead USD/JPY to the long-term bearish market zone.
Support levels: 133.70, 133.45, 133.07, 132.70, 130.57, 129.55, 127.22
Resistance levels: 135.00, 135.14, 13 7.00, 137.80, 138.90
 English
 Русский
 Bahasa Indonesia
 Bahasa Malay
 ไทย
ไทย Español
 Deutsch
 Български
 Français
 Tiếng Việt
 中文
中文 বাংলা
বাংলা हिन्दी
 Čeština
 Українська
 Română

