Over the past two weeks, Bitcoin experienced a consolidation movement, which subsequently turned into a bullish momentum. As a result, the cryptocurrency consolidated above $30k and sent market players into a euphoric mood.
Bullish trends also became noticeable in the altcoin market, thanks to the success of Ethereum update. Subsequently, the price of the main altcoin reached the $2,000 mark, which dramatically increased investor demand for altcoins.
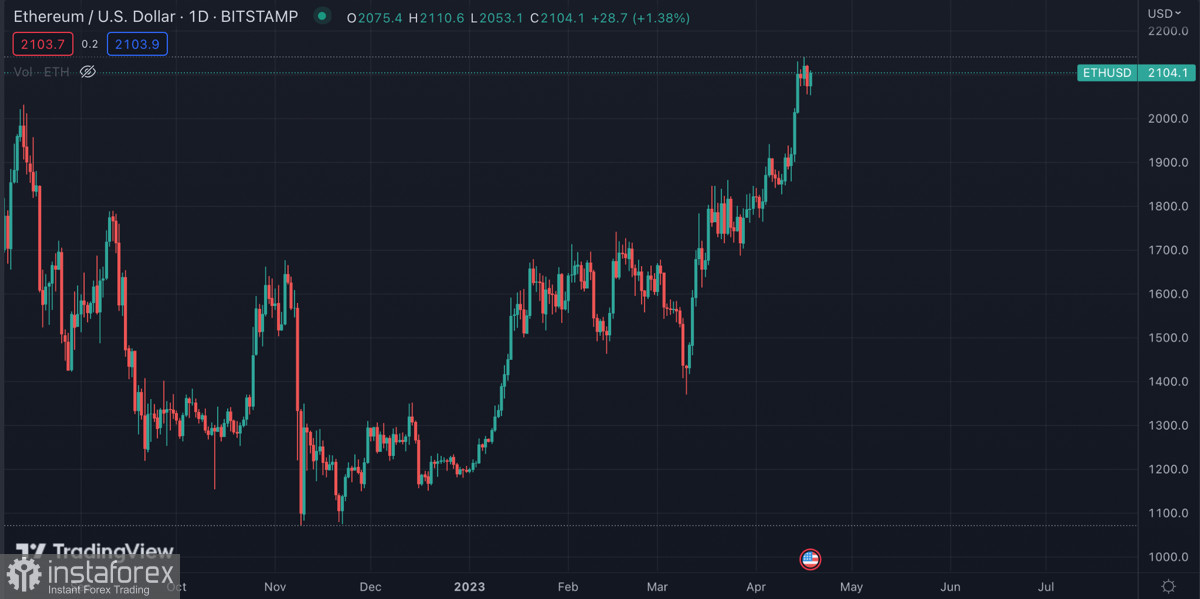
However, we did not see any serious signals indicating the continuation of the upward movement of cryptocurrencies. On the contrary, daily trading volumes for BTC began to decline and reached a local bottom at $15 billion, which is typical for the consolidation period.
SPX on the brink of an abyss?
Bitcoin and the S&P 500 index maintain their correlation, despite the fact that the cryptocurrency feels much more confident. However, similar price movement patterns of both financial instruments indicate a similarity in the audience and the quality of assets at the current stage of the market.
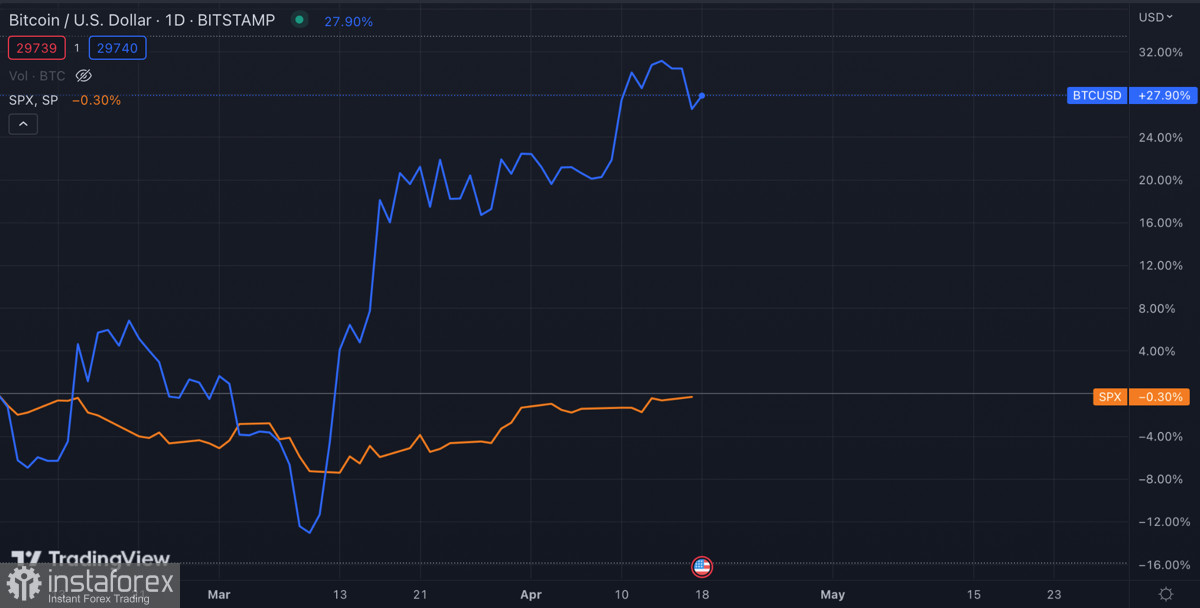
And while Bitcoin is consolidating or trying to hold the support area, SPX is preparing for the reporting season, which risks becoming the worst in the last five years. Analysts believe that, on average, S&P 500 companies will see a drop in earnings of about 6%.
Also, according to reports, the U.S. economy will experience recession in the next 6-12 months, which will exacerbate the stock market and trigger the collapse of quotes to the levels of $3,400–$3,500. A broad "wedge" pattern is already forming on the daily chart of the asset, which can later lead to a market collapse.
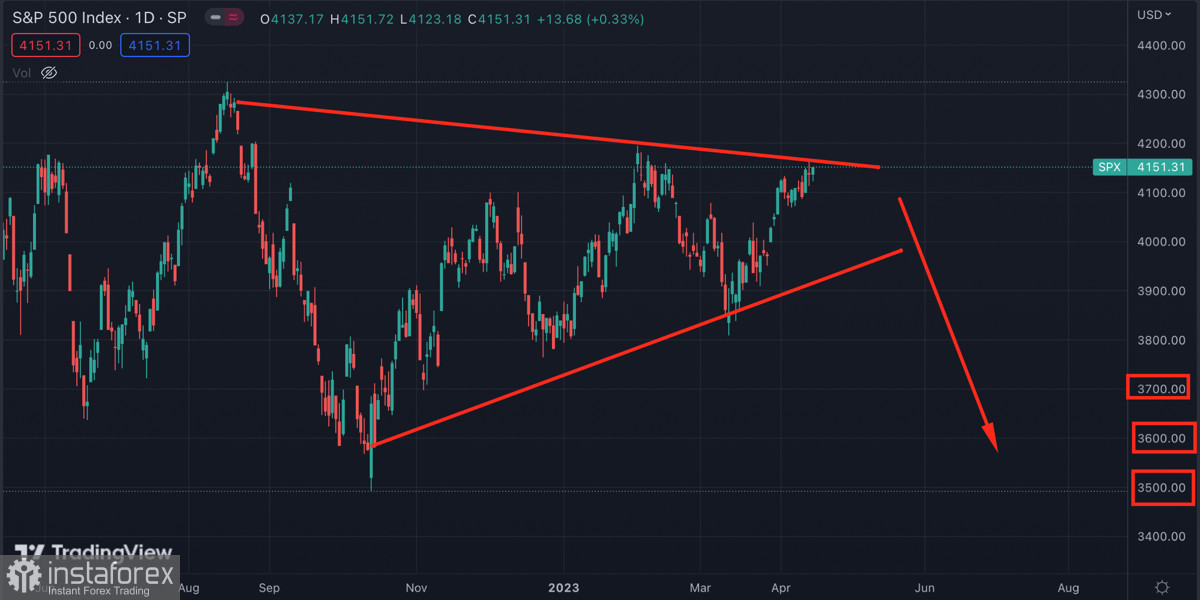
Most likely, Bitcoin and the cryptocurrency market will not share the fate of stock indices, but digital assets will also suffer in terms of investment. As of April 18, the correlation between the stock market and cryptocurrencies remains high, so the risks for BTC from the fall of the SPX should be considered.
Is Bitcoin headed for a correction?
For several days, Bitcoin was within the consolidation movement above $30k. However, having formed a local high at the $31,050 mark, the asset began to weaken. On April 17, BTC formed a "bearish engulfing" pattern and broke through the $30k level.
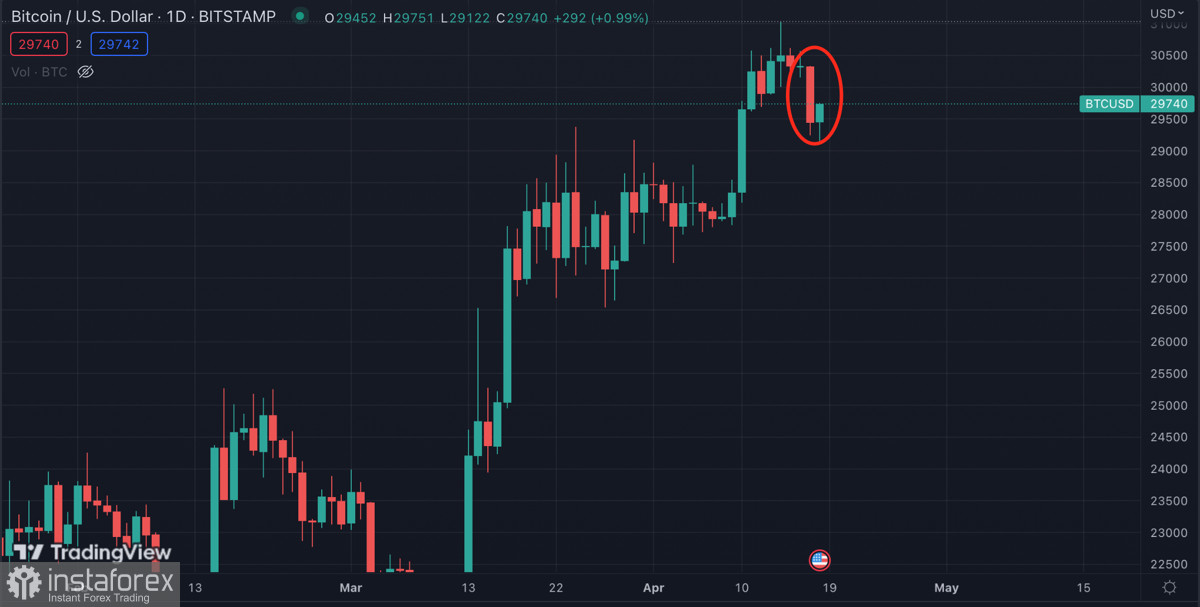
At the same time, there was a decline in trading activity, and the number of unique addresses in BTC network fell to a monthly low. This is a clear bearish signal, which indicates a slight dominance of sellers near $29k–$31k levels.
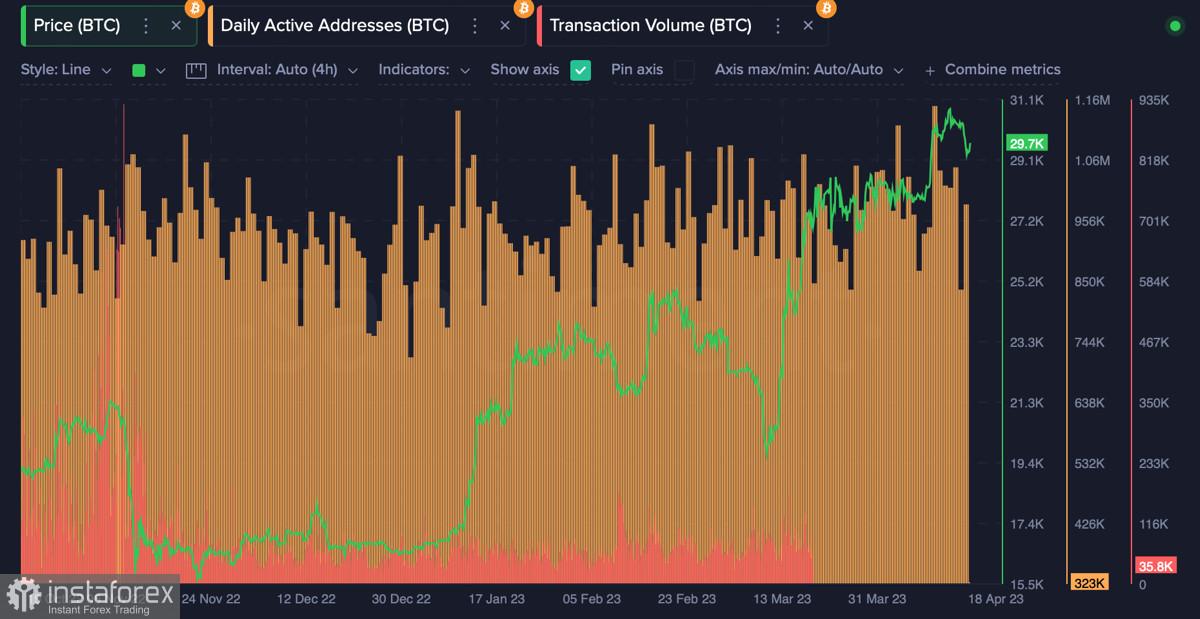
The conclusion of the previous trading day, with the formation of a powerful bearish pattern, opens a direct path for BTC to the $27.8k support level. However, before the asset continues its downward movement and confirms the probability of correction, Bitcoin must break through of the powerful support zone at $28.5k.
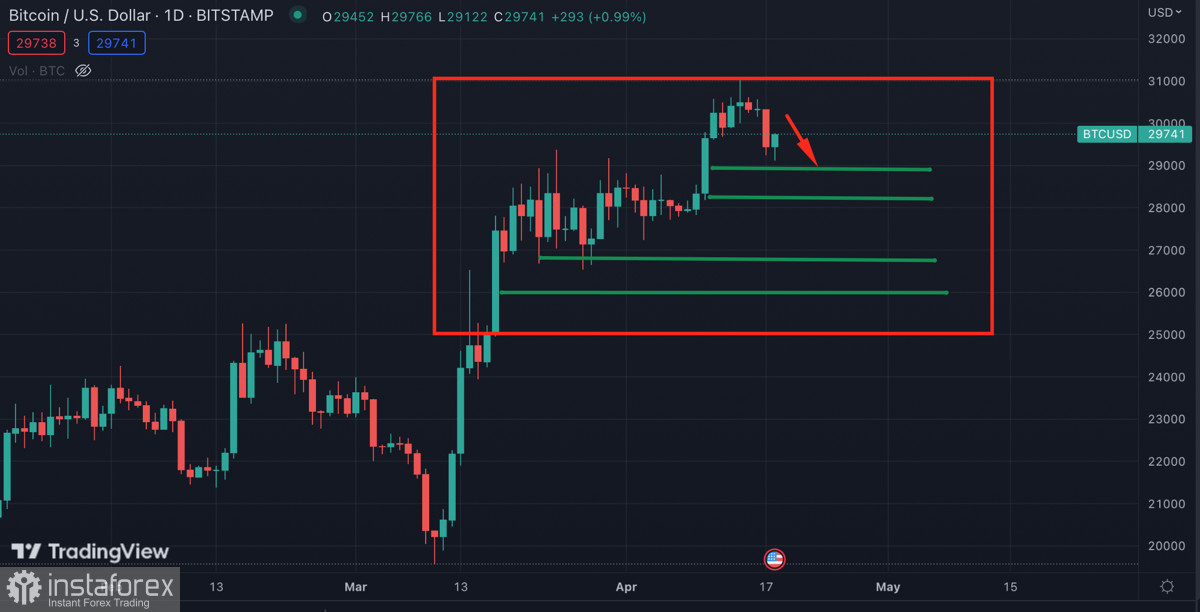
Considering this, the $28.5k level should be considered the nearest target within the downward movement. However, first of all, the asset needs to finally consolidate below the $29.1k level, where the local support zone passes, and judging by the growing bottom wick, the buyers have already activated.
Results
Technical metrics also point to the formation of a local upward momentum that emerged when the price reached levels below $29k. Buyers are still trying to protect the $28.5k level and the structure of the upward trend, so the correction period may be extended.
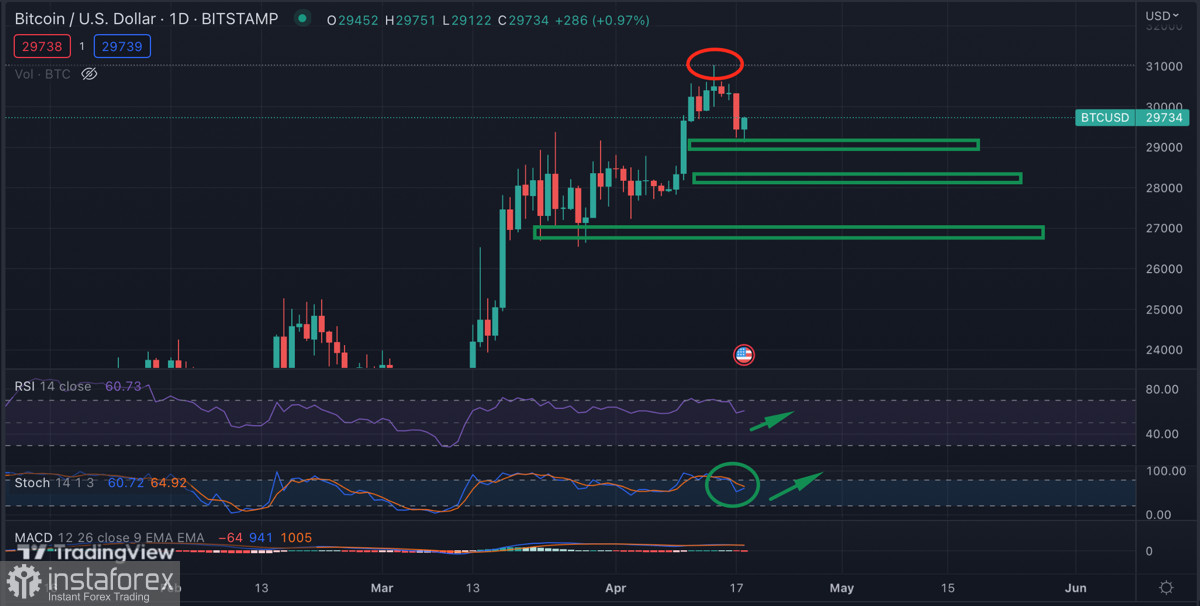
Given all the facts, there is reason to believe that BTC is approaching a deep corrective move, but specific price movements indicating this have not appeared yet. The bearish engulfing pattern was the first signal, but if we do not see an increase in bearish sentiment, the asset will continue to rise above $30k.
 English
 Русский
 Bahasa Indonesia
 Bahasa Malay
 ไทย
ไทย Español
 Deutsch
 Български
 Français
 Tiếng Việt
 中文
中文 বাংলা
বাংলা हिन्दी
 Čeština
 Українська
 Română

