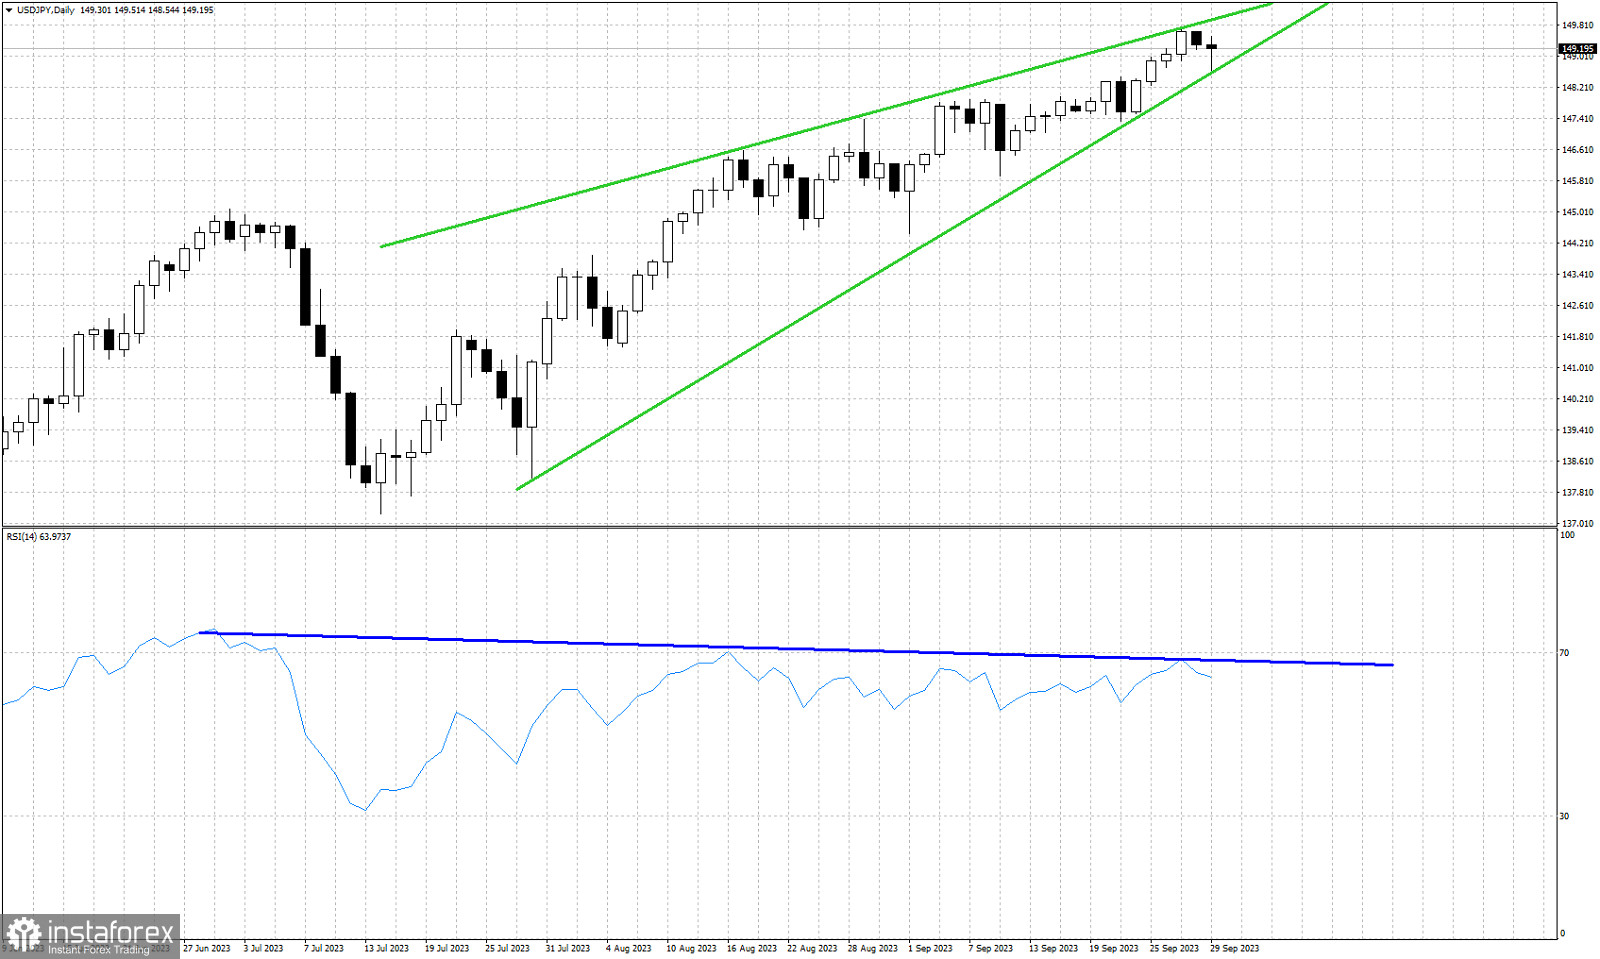
Green lines- wedge pattern
Blue line- bearish RSI divergence
USDJPY is trading around 149.23 after making a low around 148.54. As we mentioned in our previous analysis, USDJPY is inside a wedge pattern and remains in a bullish trend as price continues making higher highs and higher lows. For a second day in a row USDJPY was under pressure. Price tested the lower wedge boundary. Last time we warned traders that a pull back is expected and we continue to believe that upside potential is limited. USDJPY could continue to trade inside the wedge pattern forming new higher highs. If this happens, then today's low will be key support for the short-term trend. A break below it will change trend to bearish.
 English
 Русский
 Bahasa Indonesia
 Bahasa Malay
 ไทย
ไทย Español
 Deutsch
 Български
 Français
 Tiếng Việt
 中文
中文 বাংলা
বাংলা हिन्दी
 Čeština
 Українська
 Română

