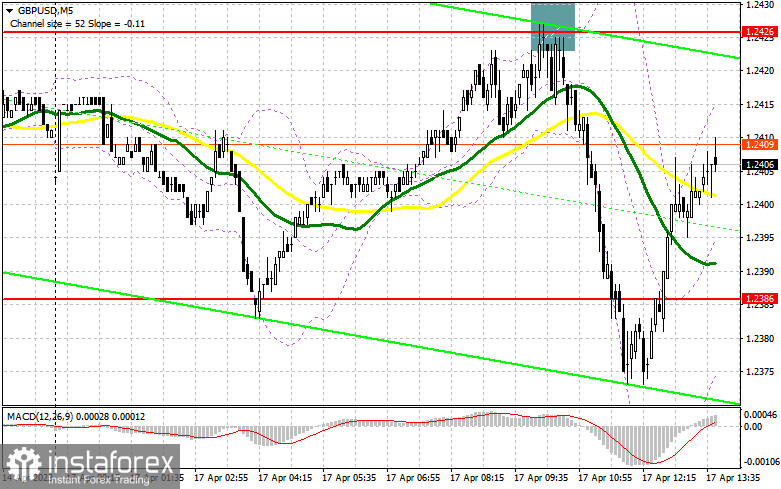
In my morning forecast, I paid close attention to level 1.2426 and recommended making entry decisions there. Let's examine the 5-minute chart to determine what transpired there. The development and formation of a false breakout at 1.2426 generated an outstanding sell signal, which resulted in a decline of more than 50 points for the pound. Even though I exceeded 1.2386 during the second part of the day, I did not revise the technical picture.

To establish long positions on the GBP/USD, you must:
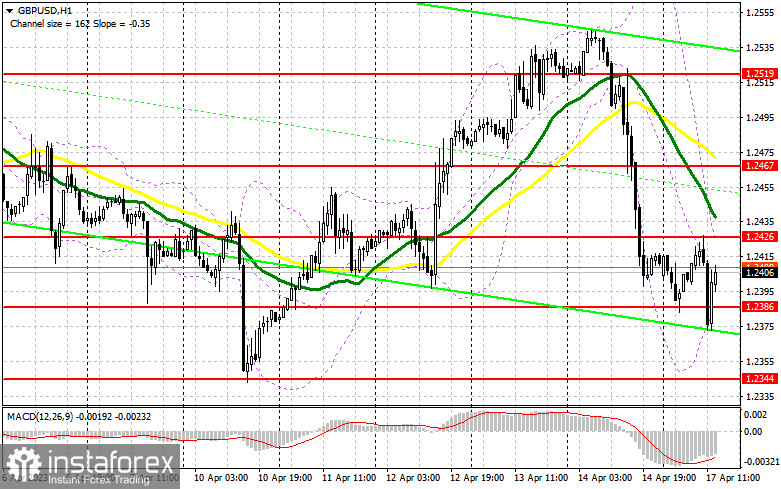
The lack of data for the United States can now play the same cruel joke on buyers as the lack of data for the United Kingdom did in the morning. Bulls must do everything possible to maintain a position above 1.2386 at the end of the trading session; otherwise, the downward correction will continue. Only protecting the nearest support of 1.2386 with a false breakout will enable you to enter long positions with the possibility of a return to 1.2426, which you could not do in the morning. Controlling this level will be a significant challenge. A breakout and consolidation above this range will be an additional signal to purchase the pound at 1.2467, where the moving averages favor the bears. The area around 1.2519 will be the farthest target, but we are unlikely to reach it by the beginning of this week. I will adjust the profit. Under the scenario of a decline to the 1.2386 area and the lack of bullish activity, and given that this level has already been breached in the first half of the trading day, I do not believe that it is best not to hurry into buying. In this case, I will only initiate long positions on a false breakout in 1.2344, the next support area. I intend to purchase GBP/USD immediately for a rebound from the minimum of 1.2310 to fix the 30-35 points within a day.
To initiate short GBP/USD positions, you must have the following:
The sellers' strategies remain unchanged: a false breakout at 1.2426, similar to what I discussed previously, will provide another opportunity to continue the correction with the possibility of a breakdown at 1.2386. Following strong data on the New York Empire State manufacturing activity index, a breakthrough and a reverse challenge from the bottom up of this range will increase pressure on the pound, forming a sell signal with a decline to 1.2344. At least 1.2310 remains the farthest target, where I will adjust the profit. With the possibility of GBP/USD growth and inactivity at 1.2426 in the afternoon, which is also quite likely given that this level has already been tested once, it is advisable to delay sales until the next test of the resistance at 1.2467. Only a false breakout will provide a point of entry into short positions. Without a decline, I will sell GBP/USD for an imminent rebound from the maximum of 1.2519, but only if the pair corrects lower by 30-35 points within the day.

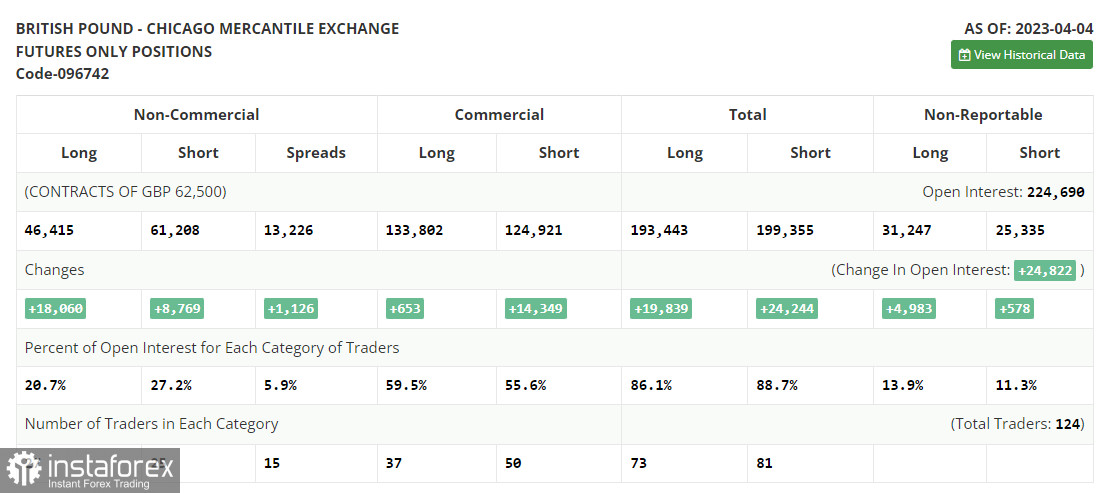
In the COT report (Commitment of Traders) for April 4, both long and short positions increased. However, according to the chart, this did not substantially affect the pair's downward correction, which is nearing completion. This week, the next data on UK GDP growth rates are anticipated, which may be sufficient for the pound's purchasers to regain control and return to monthly highs. There are no anticipated statements from representatives of the Bank of England; therefore, the market's reaction to the American inflation and retail sales statistics is also crucial. These numbers are sufficient to restore the dollar's strength. According to the most recent COT report, short non-profit positions increased by 8,769 to 61,109, while long non-profit positions increased by 18,060 to 46,415; this resulted in a significant decrease in the negative value of the non-profit net position to -14,793 from -24,084 the previous week. The weekly closing price increased from 1.224 to 1.2519.

Indicator signals:
Moving Averages
The pair is trading below its 30-day and 50-day moving averages, indicating a further decline.
The author considers the period and prices of moving averages on the hourly chart H1, which differ from the standard definition of daily moving averages on the daily chart D1.
Bollinger Bands
In the event of a decline, the indicator's lower limit near 1.2370 will act as support.
Description of indicators
- Moving average (moving average determines the current trend by smoothing out volatility and noise). Period 50. The graph is marked in yellow.
- Moving average (moving average determines the current trend by smoothing out volatility and noise). Period 30. The graph is marked in green.
- MACD indicator (Moving Average Convergence / Divergence - moving average convergence/divergence) Fast EMA period 12. Slow EMA period 26. SMA period 9
- Bollinger Bands (Bollinger Bands). Period 20
- Non-profit speculative traders, such as individual traders, hedge funds, and large institutions, use the futures market for speculative purposes and to meet certain requirements.
- Long non-commercial positions represent the total long open position of non-commercial traders.
- Short non-commercial positions represent the total short open position of non-commercial traders.
- Total non-commercial net position is the difference between the short and long positions of non-commercial traders.
 English
 Русский
 Bahasa Indonesia
 Bahasa Malay
 ไทย
ไทย Español
 Deutsch
 Български
 Français
 Tiếng Việt
 中文
中文 বাংলা
বাংলা हिन्दी
 Čeština
 Українська
 Română

