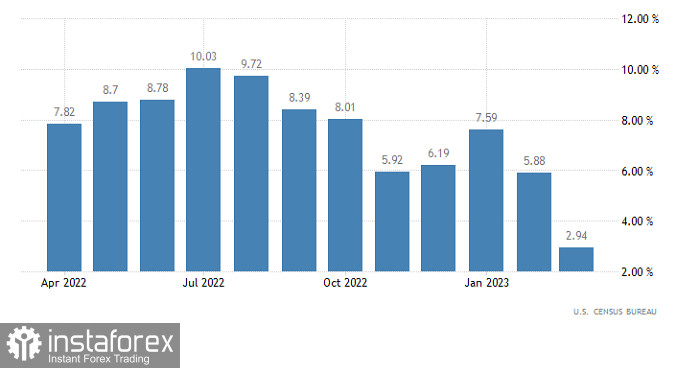
US retail sales dropped 1.0% last month. However, this wasn't the only thing that could somehow upset investors, while they were pleased with all the other reports. Data for February was revised up to show retail sales falling 0.2% instead of 0.4% as previously reported. Industrial production was really impressive, after upwardly revised increases of 0.2% in February (0.0% previously) and 0.9% in January. And although they slowed down to 0.5%, this is much better than the -0.9% decline that everyone was expecting. So, judging by all these reports, we can say that although the American economy is slowing down, it is still too early to talk about any recession. And that was the reason for the rebound. So in the grand scheme of things, the pace of growth slowed down, which is more of a negative factor. Even though the data turned out to be better than forecasts. The main thing is the signal of the euro's overbought conditions. The market was simply looking for a reason for a small correction. Now, the market is likely to consolidate around the reached values, since today's economic calendar is absolutely empty.
Retail sales (United States):

EURUSD was in an upward cycle for almost the entirety of last week. As a result, it updated the local high in the mid-term. Due to the obvious signal of the euro's overbought conditions in the intraday period, a pullback occurred, which returned the quote to 1.1000.
On the four-hour chart, the RSI technical indicator confirmed the signal of the euro's overbought conditions with the indicator hovering above the 70 level. Subsequently, the indicator left the overbought area, indicating the pullback stage.
On the four-hour chart, two of the three Alligator's MAs are intertwined. This points to a slowdown in the upward cycle.

Outlook
We can assume that the pullback has slowed down around the psychological level. This may lead to a temporary stagnation; however, if the quote climbs above the 1.1050 mark, there could be a new round of growth in the volume of long positions. As for prolonging the pullback, it is necessary to keep the price below the 1.0950 value on the four-hour chart.
The complex indicator analysis unveiled that in the short-term and intraday periods, indicators are pointing to a pullback. Meanwhile, in the daily period, the indicators are reflecting an upward cycle.
 English
 Русский
 Bahasa Indonesia
 Bahasa Malay
 ไทย
ไทย Español
 Deutsch
 Български
 Français
 Tiếng Việt
 中文
中文 বাংলা
বাংলা हिन्दी
 Čeština
 Українська
 Română

