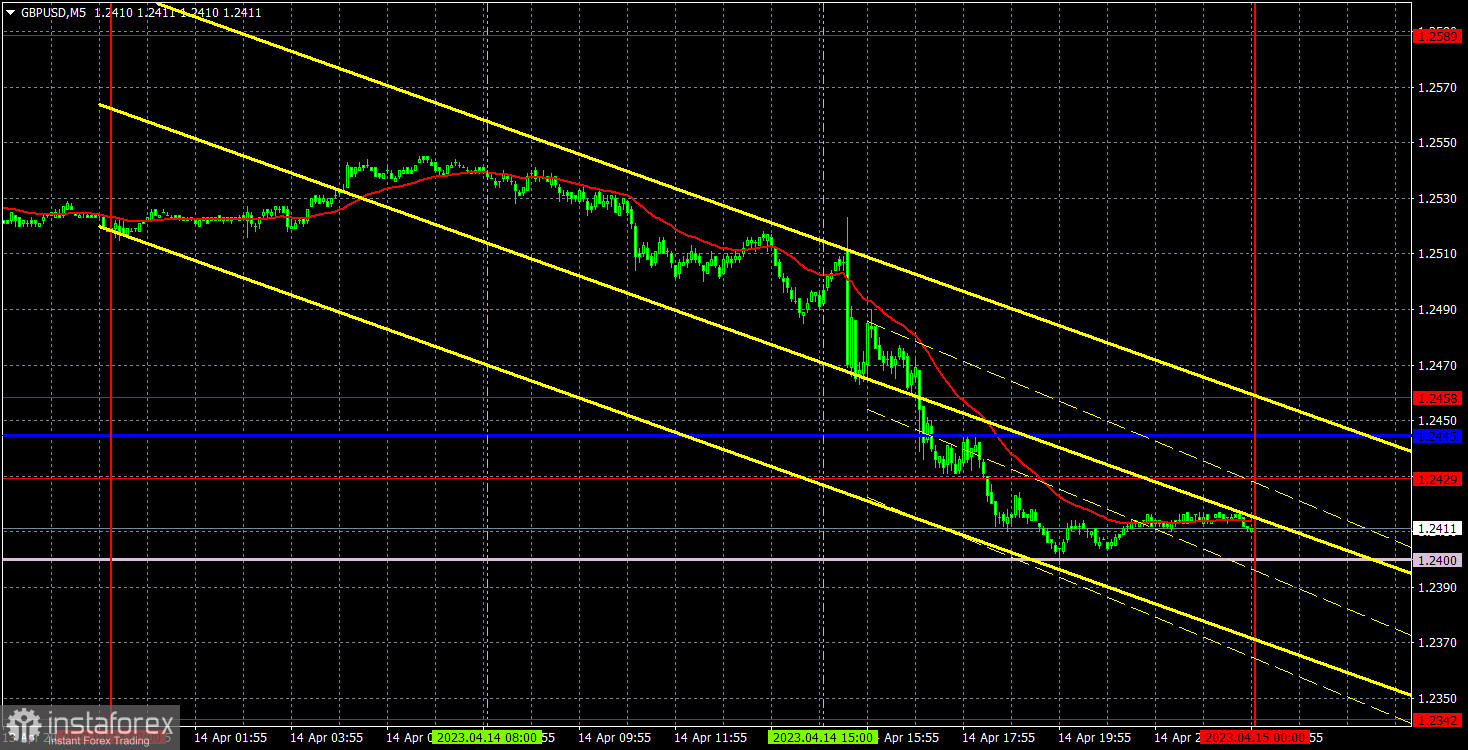
5M chart of GBP/USD

The GBP/USD pair traded in a similar style to the EUR/USD pair on Friday. The pound also fell, and this began during the European trading session. Take note that the main reason why the dollar grew was because of Federal Reserve representative Christopher Waller's speech. By the end of the day, the pair ended up near the Senkou Span B line, and now it needs to overcome this line so we can expect the pound to fall further, which would be logical. Also, the price has reached another uptrend line. The last few ascending lines were overcome, but the pair's decline never stretched out. At some point, this situation must come to an end, and we hope that it will happen this time. However, we can't achieve anything if the pair doesn't break through the lower limit of the Ichimoku cloud, and the bulls have not yet left the market to write off the British currency. Although it is rising without any fundamental reason, it is still not a reason why we can't expect GBP to strengthen.
No trading signals were formed on Friday, despite volatility of nearly 150 points. More precisely, the price began to cross lines and levels during the US session, but they were all located very close to each other, which we can see in the chart above. Therefore, it was not necessary to open positions. The pair rebounded perfectly from the Senkou Span B line, but did not overcome the trend line, so the uptrend persists.
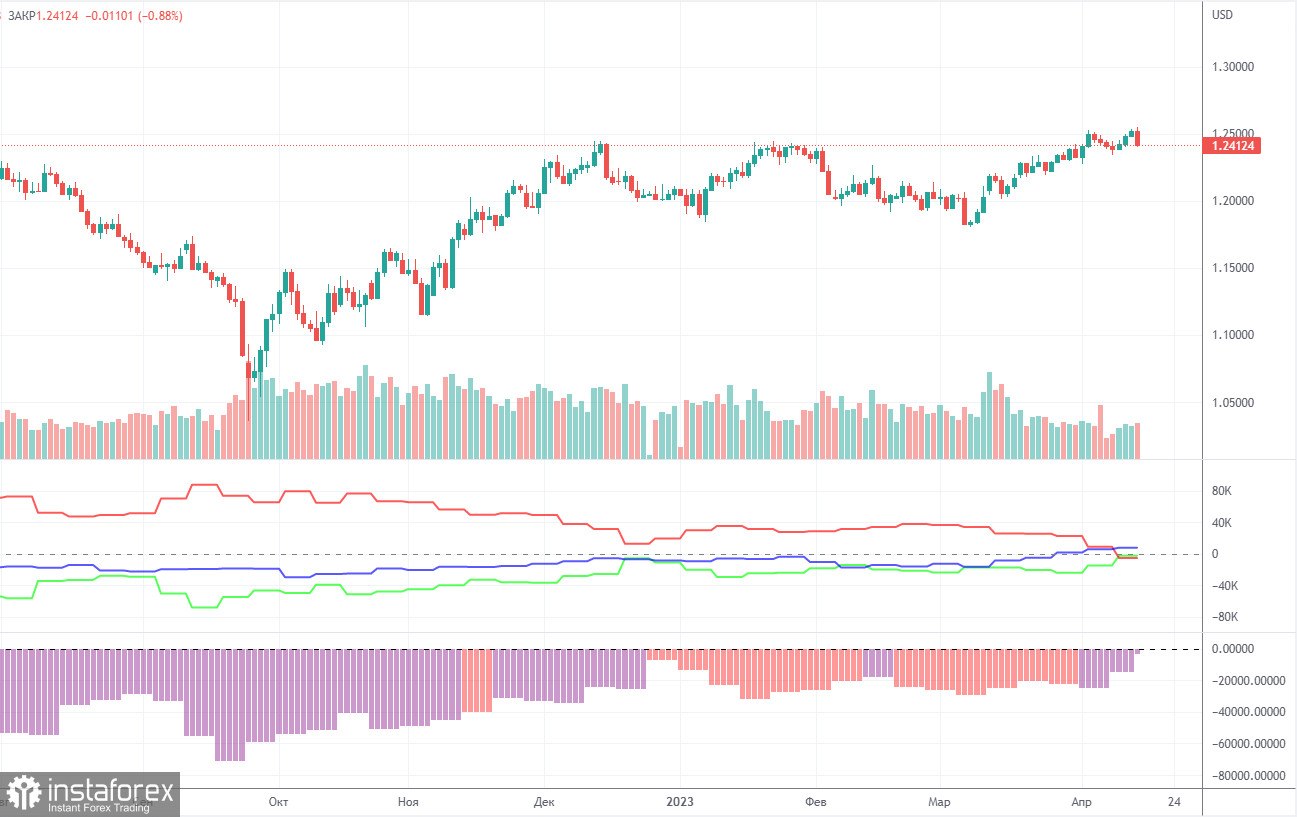
COT report:

According to the latest COT reports for the British pound, the non-commercial group opened 8,500 long positions and closed 3,800 shorts. As a result, the net position of non-commercial traders increased by 12,300 and continues to grow. The net position indicator has been steadily rising for the past 8-9 months, but the sentiment of major players remains bearish. Although the sterling is growing against the US dollar in the medium term, it is very difficult to figure out the reasons for the sterling's rally from a fundamental point of view. We absolutely do not exclude the scenario in which a sharper drop in the pound will begin in the near future. We also note that both major pairs are currently following roughly the same pattern, but the net position for the euro is positive and even implies a soon-to-be-ending upward momentum, while for the pound, it is negative, which suggests further growth. The British currency has already rallied by 2,100 points. It is stunning growth without a strong downward correction, so a further rally will be absolutely illogical. The non-commercial group now holds a total of 57,000 shorts and 55,000 longs open. We are still skeptical about the long-term uptrend of the British currency and expect it to fall.
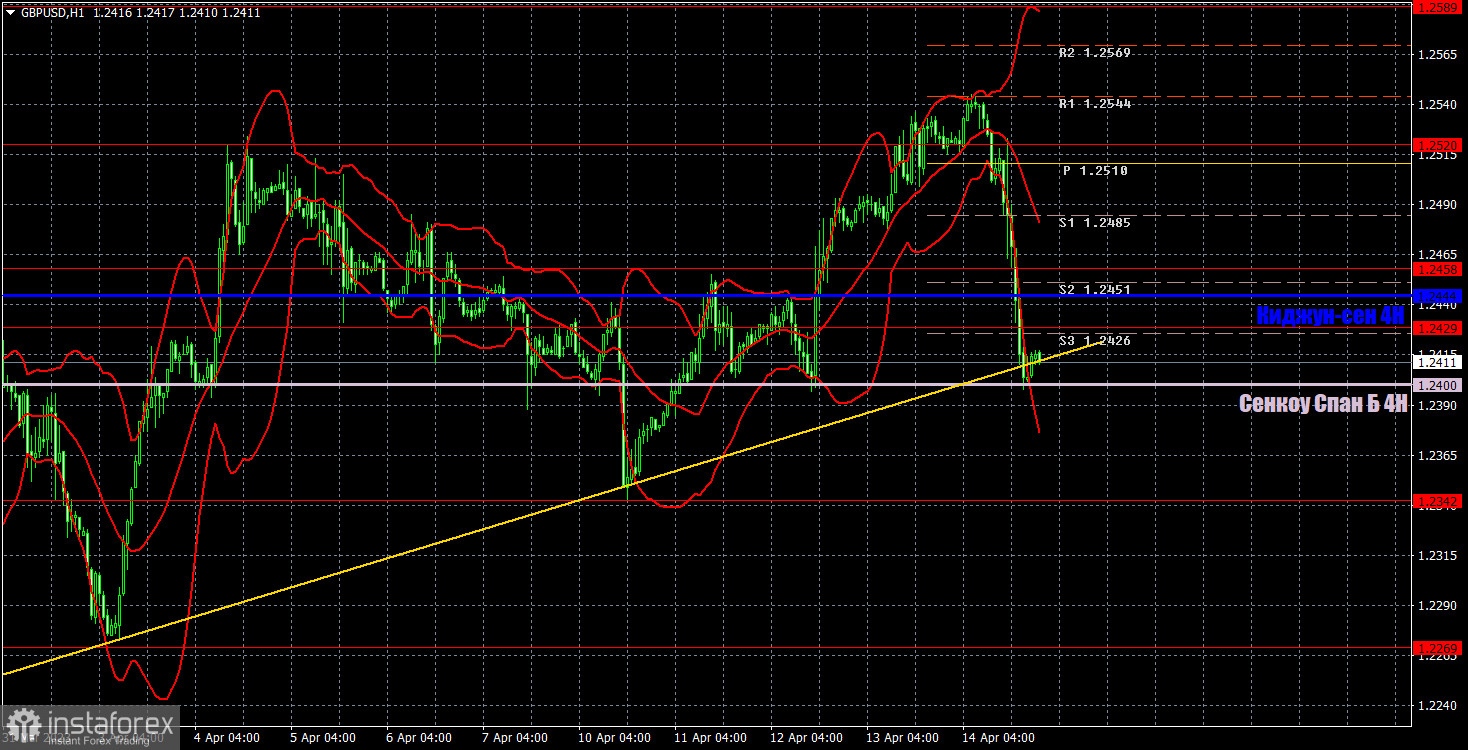
1H chart of GBP/USD

On the one-hour chart, GBP/USD maintains an upward momentum, although it still fell to two critical lines. Consolidating below both would significantly increase the likelihood of further decline, but remember that this has happened several times in the past month, and the pound still manages to rise despite the lack of good reasons. It could be the same this time. For April 17, we highlight the following important levels: 1.1927, 1.1965, 1.2143, 1.2185, 1.2269, 1.2342, 1.2429-1.2458, 1.2520, 1.2589, 1.2659, 1.2762. The Senkou Span B (1.2400) and Kijun-sen (1.2444) lines can also be sources of signals. Rebounds and breakouts from these lines can also serve as trading signals. It is better to set the Stop Loss at breakeven as soon as the price moves by 20 pips in the right direction. The lines of the Ichimoku indicator can change their position throughout the day which is worth keeping in mind when looking for trading signals. On the chart, you can also see support and resistance levels where you can take profit. No important events are scheduled for Monday in the UK and US, so there's nothing to pay attention to. Volatility is likely to decrease, and it will be difficult for the price to overcome the Senkou Span B and the trend line on Monday, which is often very sluggish.
Indicators on charts:
Resistance/support - thick red lines, near which the trend may stop. They do not make trading signals.
Kijun-sen and Senkou Span B are the Ichimoku indicator lines moved to the hourly timeframe from the 4-hour timeframe. They are also strong lines.
Extreme levels are thin red lines, from which the price used to bounce earlier. They can produce trading signals.
Yellow lines are trend lines, trend channels, and any other technical patterns.
Indicator 1 on the COT chart is the size of the net position of each trader category.
Indicator 2 on the COT chart is the size of the net position for the Non-commercial group of traders.
 English
 Русский
 Bahasa Indonesia
 Bahasa Malay
 ไทย
ไทย Español
 Deutsch
 Български
 Français
 Tiếng Việt
 中文
中文 বাংলা
বাংলা हिन्दी
 Čeština
 Українська
 Română

