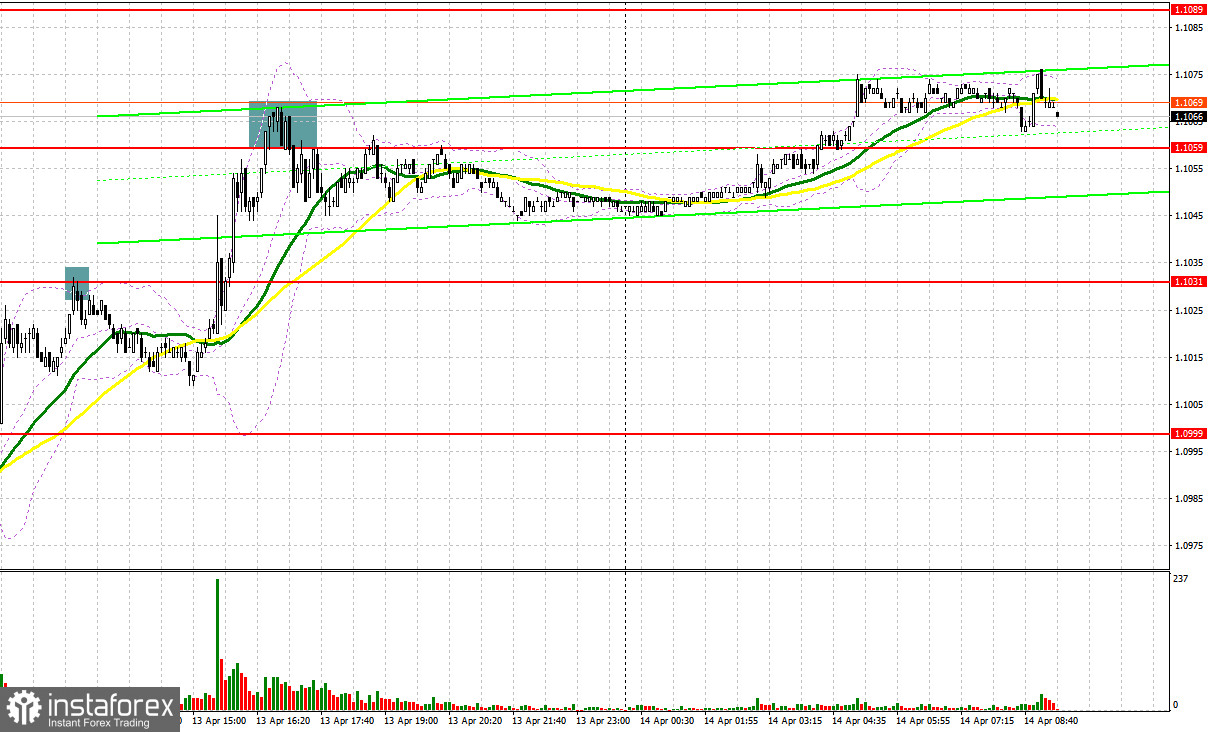
Yesterday, several market entry signals were formed. Let's take a look at the 5-minute chart and analyze what happened there. In my morning forecast, I mentioned the level of 1.1031 and recommended making market entry decisions from there. A rise to this level and its false breakout formed an entry point for selling the euro. As a result, the pair declined by 20 pips which was sufficient for a correction against the bullish trend. In the second half of the day, the pair rose to another resistance area at 1.1059. Selling from there after a rebound brought me only about 10 pips in profit as there was no larger downward movement.
To open long positions on EUR/USD:
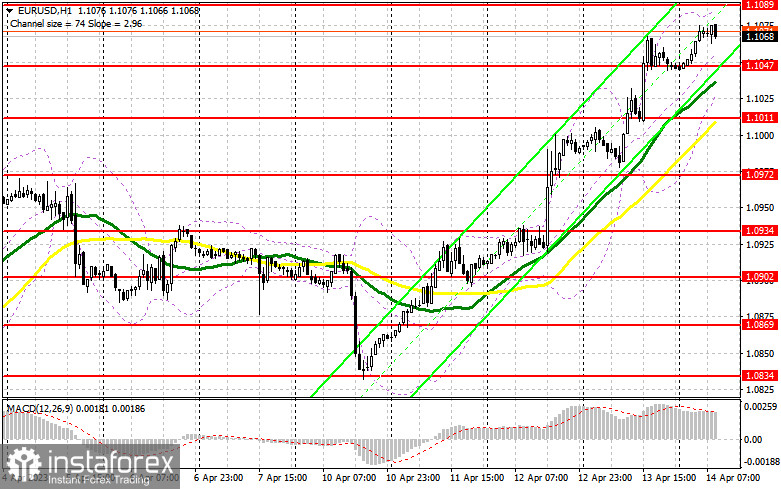
The bullish trend continues, and the euro is ready to retest the monthly highs. However, it's important to understand that today is the end of the week, during which the pair has been rising almost non-stop. So you should be cautious when buying the pair at the highs. Given that there is no significant data in the eurozone today, the upward potential will be limited. It's better to trade on a decline near the support of 1.1047. Inflation data from France and Spain may help form a false breakout at this level, leading to a buy signal and a rise to a new monthly high of 1.1089. A breakout and a top-down test of this range will strengthen buyers' confidence, preserving the upward trend and forming an additional entry point for adding long positions with a target at the next resistance at 1.1125. The ultimate target remains the 1.1174 area where I'm going to take profit. The price may head there after the speech by ECB board member Joachim Nagel. If EUR/USD declines and bulls are idle at 1.1047, which may happen already in the first half of the day, pressure on the euro will increase, and we will see a return to the level of 1.1011 where the moving averages support the bulls. Only the formation of a false breakout at this level will give a signal to buy the euro. I will open long positions on the rebound immediately from the low of 1.0972, keeping in mind an upward correction of 30-35 pips within the day.
To open short positions on EUR/USD:
Sellers have little to offer, and the only thing we can currently expect is a correction of the euro at the end of the week after its recent significant rise. In case of further growth in EUR/USD in the first half of the day amid strong data from France and Spain, bears will need to protect the 1.1089 range. There, I expect to see the formation of a false breakout, which could lead to a decline of the pair to the nearest support area of 1.1047 where a real battle will unfold. This level is decisive in the short-term perspective as its breakout and a retest will increase pressure, leading to a downward correction. If so, EUR/USD may go down to 1.1011. Consolidation below this range will open the way to 1.0972 where I recommend locking in profits. In the event of an upward movement in EUR/USD during the European session and the absence of bears at 1.1089, which is more likely, especially in such a bullish market, I recommend opening short positions only upon reaching the 1.1125 level. Going short at this point can be done only after failed consolidation. I will open short positions on the rebound immediately from the high of 1.1174, bearing in mind a downward correction of 30-35 pips.

COT report
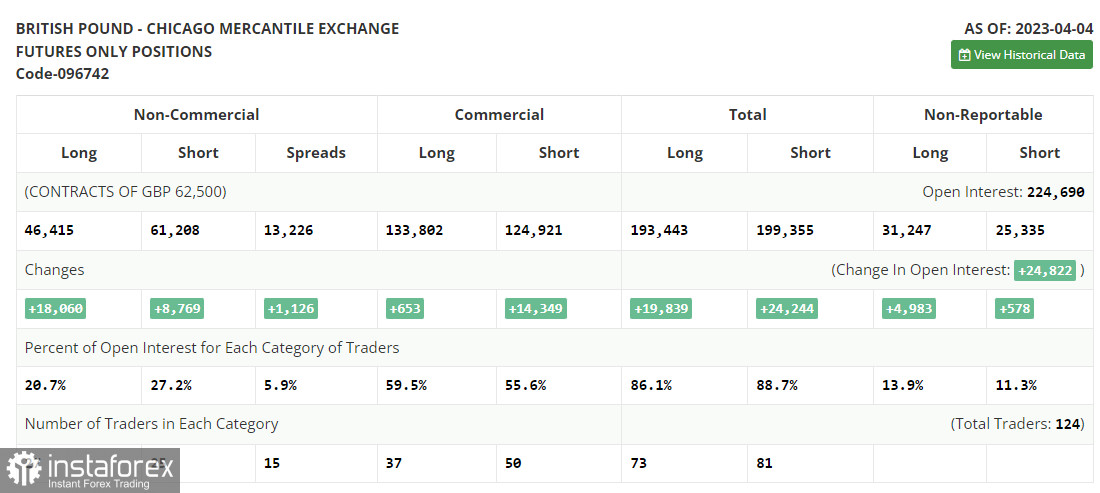
The COT report for April 4th recorded a rise in both long and short positions. Considering that nothing particularly interesting happened last week, and the jobs data met market expectations, buyers of risk assets, including the euro, will be waiting for a crucial batch of inflation and retail sales data in the US for March. The minutes of the Federal Reserve's March meeting will also be in the focus of traders. If it suggests a need for further interest rate hikes, the US dollar may recover some of its recent losses. However, if the incoming data suggests that the Fed could ease its monetary policy, the euro is likely to rise further. The COT report shows that long positions of the non-commercial group of traders increased by 2,498 to 225,416, while short positions jumped by 4,130 to 82,023. As a result, the total non-commercial net position fell to 143,393 from 145,025. The weekly closing price increased to 1.1 against 1.0896.

Indicator signals:
Moving Averages
Trading above the 30- and 50-day moving averages indicates a further rise in the euro.
Please note that the time period and levels of the moving averages are analyzed only for the H1 chart, which differs from the general definition of the classic daily moving averages on the D1 chart.
Bollinger Bands
If the pair declines, the lower band of the indicator at 1.1020 will serve as support.
Description of indicators:
• A moving average of a 50-day period determines the current trend by smoothing volatility and noise; marked in yellow on the chart;
• A moving average of a 30-day period determines the current trend by smoothing volatility and noise; marked in green on the chart;
• MACD Indicator (Moving Average Convergence/Divergence) Fast EMA with a 12-day period; Slow EMA with a 26-day period. SMA with a 9-day period;
• Bollinger Bands: 20-day period;
• Non-commercial traders are speculators such as individual traders, hedge funds, and large institutions who use the futures market for speculative purposes and meet certain requirements;
• Long non-commercial positions represent the total number of long positions opened by non-commercial traders;
• Short non-commercial positions represent the total number of short positions opened by non-commercial traders;
• The non-commercial net position is the difference between short and long positions of non-commercial traders.
 English
 Русский
 Bahasa Indonesia
 Bahasa Malay
 ไทย
ไทย Español
 Deutsch
 Български
 Français
 Tiếng Việt
 中文
中文 বাংলা
বাংলা हिन्दी
 Čeština
 Українська
 Română

