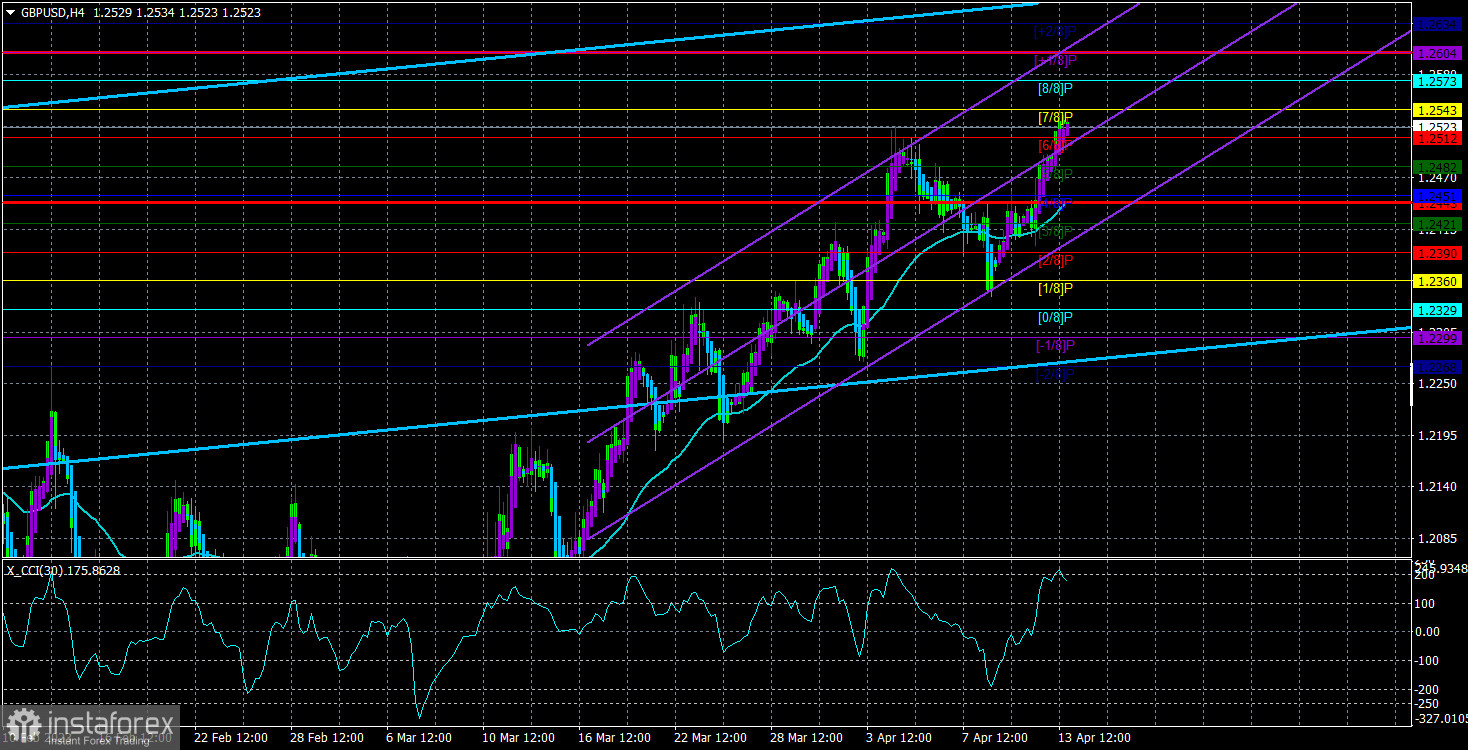
The currency pair GBP/USD on Thursday also continued its upward movement. As with the euro, there are plenty of reasons for the rise of the British currency. For example, the market has been reacting to the recent US inflation report for two days. However, these are just "explanations" rather than logical reasons and arguments. We want to draw attention to the fact that if the euro had theoretical grounds for growth on Thursday (after all, the statistics favored the euro), the pound had none. This point is very important because it proves our point. In the morning, the UK published a GDP report – worse than forecasts, with no growth indicator. Industrial production is much worse than expected. Trade balance: much worse than expected. But the market paid no attention to the weak statistics from the UK and has continued buying since the morning. That's why we think the Eurozone industrial production report is not the reason for the euro's strengthening. The market buys euros and pounds, paying no attention to anything.
Thus, the British pound quickly and easily overcame its last local maximum and grew. Technically, everything is almost perfect now. On the 4-hour timeframe, all indicators are pointing up. The Heiken Ashi indicator, which should respond quickly to the beginning of corrections, doesn't even try to turn down. The pair cannot start a downward movement, even if it falls below the moving average. It seems traders need to open long positions daily and collect profit! However, we are very concerned about such groundless, inertial movements. The fact is that sooner or later, there will be a "restoration of justice," and the dollar will grow for a reason or without one. The best option now is to trade intraday.
FOMC minutes.
On Wednesday evening, the FOMC minutes were published in the States. This paragraph can be ended here because it contains no important information. The Federal Reserve once again confirmed that a 2% inflation rate is its main goal, and a banking crisis in the US could lead to a decrease in the expected maximum key rate. This is very important information, considering that the market is doubting even one more monetary policy tightening after the last inflation report. The inflation rate has already dropped to 5%, and there is no doubt that it will continue to decline. Maybe not at such high rates, but it will continue. Thus, why should the Fed "push the horses" now, pressuring its economy? To stimulate it again in a year and re-accelerate inflation? Therefore, the minutes turned out to be uninformative and unimportant.
At the same time, UK Finance Minister Jeremy Hunt happily announced that there would be no recession in the UK! On what basis he made such a conclusion is very difficult to say because just yesterday, a February GDP report was released, informing the markets of zero growth. This, of course, is not a decline or recession, but it is also not growth. The British economy will most likely avoid a deep recession, but inflation remains above 10% and is in no hurry to fall. This means that the Bank of England needs to continue raising the rate at the maximum pace, but it has already lowered it to the minimum and is preparing to take a break or even end the tightening cycle. Thus, even based on these factors, the pound should not show growth. But it does, and feels no shame about it. In the 24-hour timeframe, the pair can remain within the sideways channel, although the chances are minimal and melting before our eyes.

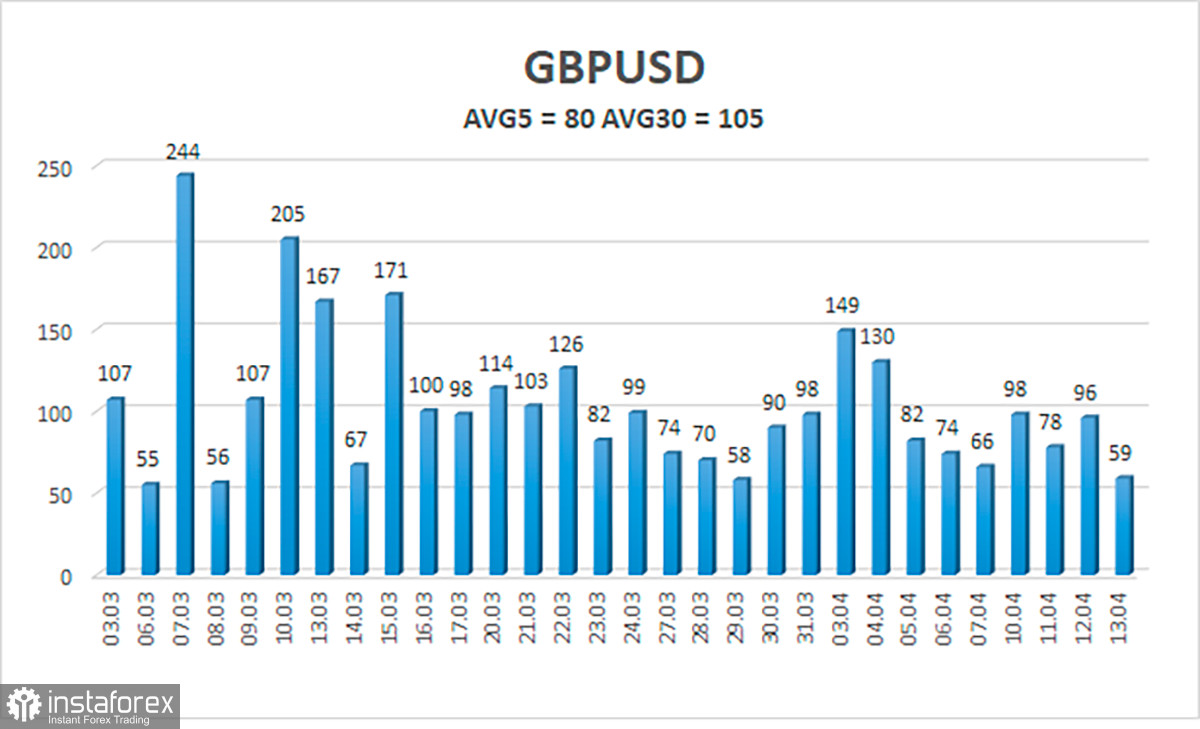
The average volatility of the GBP/USD pair over the last five trading days is 80 points. For the pound/dollar pair, this value is considered "average." Therefore, we anticipate movement within a channel with levels 1.2443 and 1.2603 as its boundaries on Friday, April 14. A reversal of the Heiken Ashi indicator downwards will signal a corrective movement turn.
Nearest support levels:
S1 – 1.2512
S2 – 1.2482
S3 – 1.2451
Nearest resistance levels:
R1 – 1.2543
R2 – 1.2573
R3 – 1.2604
Trading recommendations:
The GBP/USD pair in the 4-hour timeframe continues to be above the moving average. You can stay in long positions with targets of 1.2573 and 1.2604 until the Heiken Ashi indicator reverses downward. Short positions can be considered if the price consolidates below the moving average, with targets of 1.2390 and 1.2360.
Explanation of illustrations:
Linear regression channels - help to determine the current trend. If both are directed in one direction, the trend is strong.
Moving average line (settings 20, 0, smoothed) - determines the short-term tendency and direction in which trading should now be conducted.
Murrey levels - target levels for movements and corrections.
Volatility levels (red lines) - the probable price channel in which the pair will spend the next day, based on current volatility indicators.
CCI indicator - its entry into the oversold area (below -250) or overbought area (above +250) means a trend reversal in the opposite direction is approaching.
 English
 Русский
 Bahasa Indonesia
 Bahasa Malay
 ไทย
ไทย Español
 Deutsch
 Български
 Français
 Tiếng Việt
 中文
中文 বাংলা
বাংলা हिन्दी
 Čeština
 Українська
 Română

