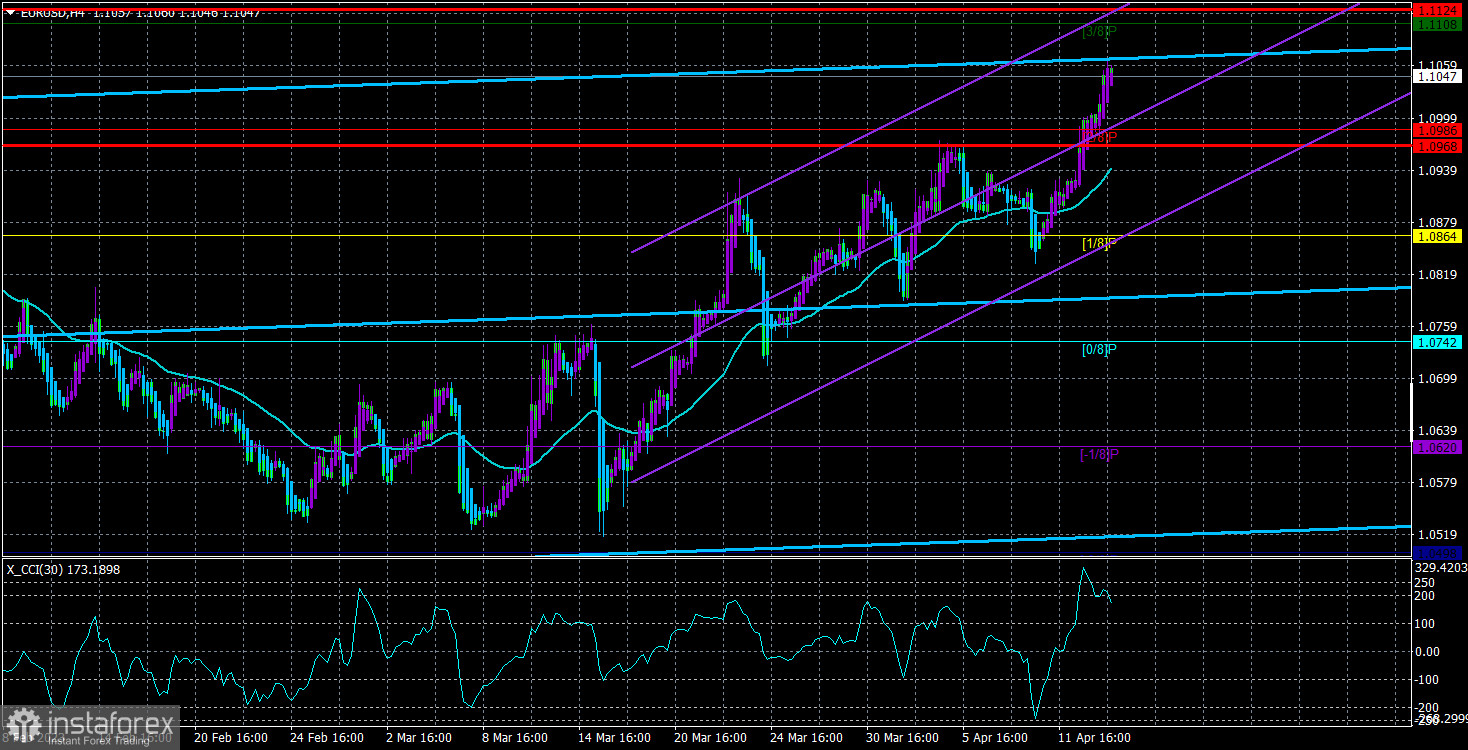
On Thursday, the currency pair EUR/USD continued its upward movement. There are probably no longer any people who would find the constant growth of the European currency surprising. A lot of various macroeconomic statistics have been published recently. But what's the difference? What is the nature of these statistics if the market interprets everything in favor of the euro? The US non-farm payrolls showed good value once again. The dollar rose by 20 points. The unemployment rate in the US decreased instead of showing growth. The dollar increased by another 20 points. As everyone expected, US inflation fell by 1%, and the dollar fell by 100 points. Industrial production in the European Union, usually not paid attention to, grew stronger than expected. Another +100 points for the euro. This is how the market trades now, and nothing can be done about it. By the way, yesterday, the euro added about 40 points even before the publication of the first report of the day.
We have repeatedly said that any report or event can be "explained" in any direction. Have traders ignored industrial production reports in the last 12 months? The report is not the most significant! Do traders work on the industrial production report? Now it's significant, and its value has surprised market participants! At this time, the growth of the European currency is too strong and unfounded, given the fundamental background. It should be understood that local macroeconomic reports are important, but if the euro adds 50–60 points to each report, it will soon be worth 2 dollars. Yesterday's growth was almost non-stop; the Heiken Ashi indicator did not even try to turn down. The 1.1000 level is a psychological mark, and traders didn't even notice.
In the 24-hour timeframe, traders have finally overcome the important Fibonacci level of 50.0%. Now growth can continue with the target level of 61.8% - 1.1272. Since the movement now resembles that of Bitcoin and is simply inertial, this mark can be reached relatively easily.
So, what triggered the next rise in the euro?
In short, the publications on Thursday had the potential to support the bulls. Industrial production in the EU indeed exceeded forecasts, and the US Producer Price Index declined more than expected. Yesterday, we said we did not expect a reaction to these reports unless their values differed significantly from the forecasted ones. However, they were different. EU production was forecast at +0.8% in February but amounted to +1.5%. The difference is almost twofold. The US Producer Price Index was -0.5% with a forecast of +0.1%. Once again, the market had formal reasons to buy, but we would not bet on the euro's growth even if we knew what the values would be. These data are too secondary. The market regularly ignores GDP reports, but now it seeks any reason to buy even more euro currency.
The ECB may lower the pace of monetary policy tightening to 0.25% in May. The majority of economists surveyed by Reuters concur with this opinion. This means that the moment when the rate stops growing is approaching. However, the market is not interested in this fact at the moment. Recall that last fall, when the first signs of US inflation slowing down began to appear, the dollar had already started to decline. The ECB is preparing to end the tightening program, but the euro currency is growing like yeast. There is no logic in the movements. On the 4-hour timeframe, in the last few days, it has been profitable to trade, as the Heiken Ashi indicator has constantly been pointing upwards. Still, the best decision now is to trade on the youngest timeframes. The growth of the European currency may end suddenly and unexpectedly with a collapse. It is already visible that after growing by 500 points within a month, the euro currency is also accelerating its upward movement.

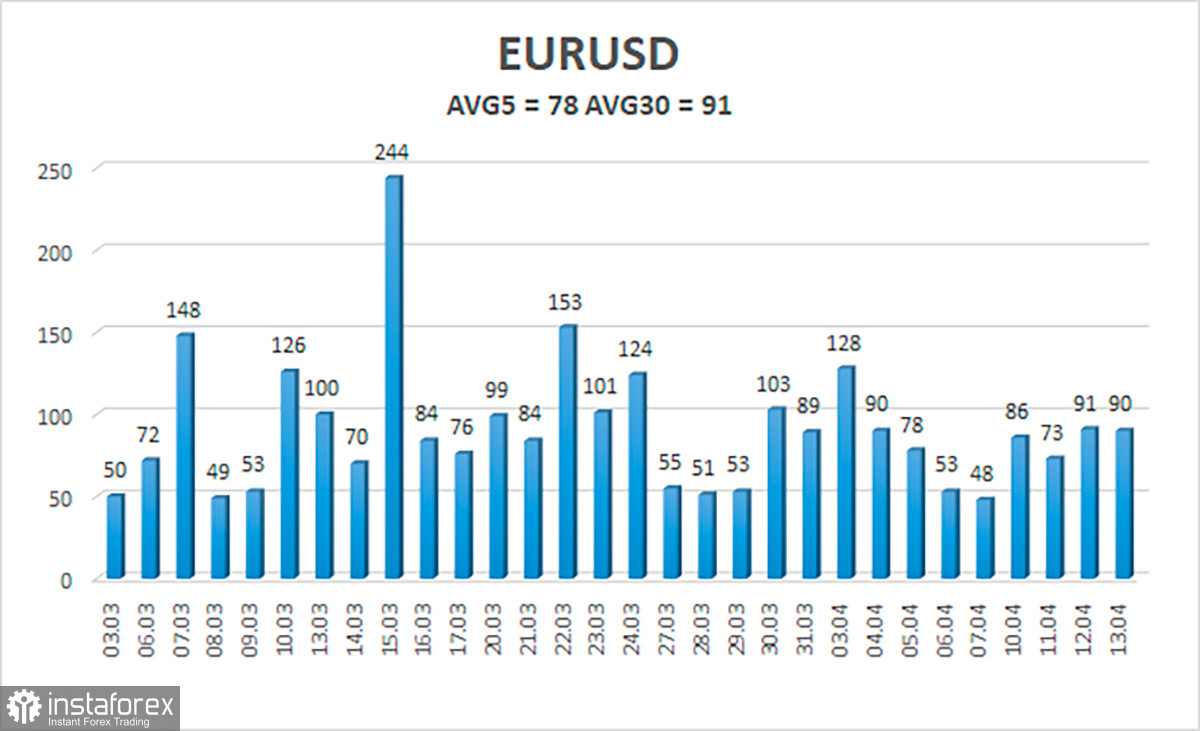
The average volatility of the euro/dollar currency pair for the last five trading days as of April 14 is 78 points and is characterized as "medium." Thus, we expect the pair to move between 1.0968 and 1.1124 on Friday. A reversal of the Heiken Ashi indicator downward will indicate a downward correction.
Nearest support levels:
S1 – 1.0986
S2 – 1.0925
S3 – 1.0865
Nearest resistance levels:
R1 – 1.1047
R2 – 1.1108
R3 – 1.1230
Trading recommendations:
The EUR/USD pair continues its upward movement. You can stay in long positions with targets of 1.1108 and 1.1124 until the Heiken Ashi indicator reverses downward. Short positions can be opened after the price consolidates below the moving average, with targets of 1.0864 and 1.0742.
Explanations for the illustrations:
Linear regression channels - help determine the current trend. The trend is strong now if both are directed in the same direction.
Moving average line (settings 20,0, smoothed) - determines the short-term trend and direction in which trading should be conducted now.
Murrey levels - target levels for movements and corrections.
Volatility levels (red lines) - the likely price channel the pair will spend the next day, based on current volatility indicators.
CCI indicator - its entry into the oversold area (below -250) or overbought area (above +250) means a trend reversal in the opposite direction is approaching.
 English
 Русский
 Bahasa Indonesia
 Bahasa Malay
 ไทย
ไทย Español
 Deutsch
 Български
 Français
 Tiếng Việt
 中文
中文 বাংলা
বাংলা हिन्दी
 Čeština
 Українська
 Română

