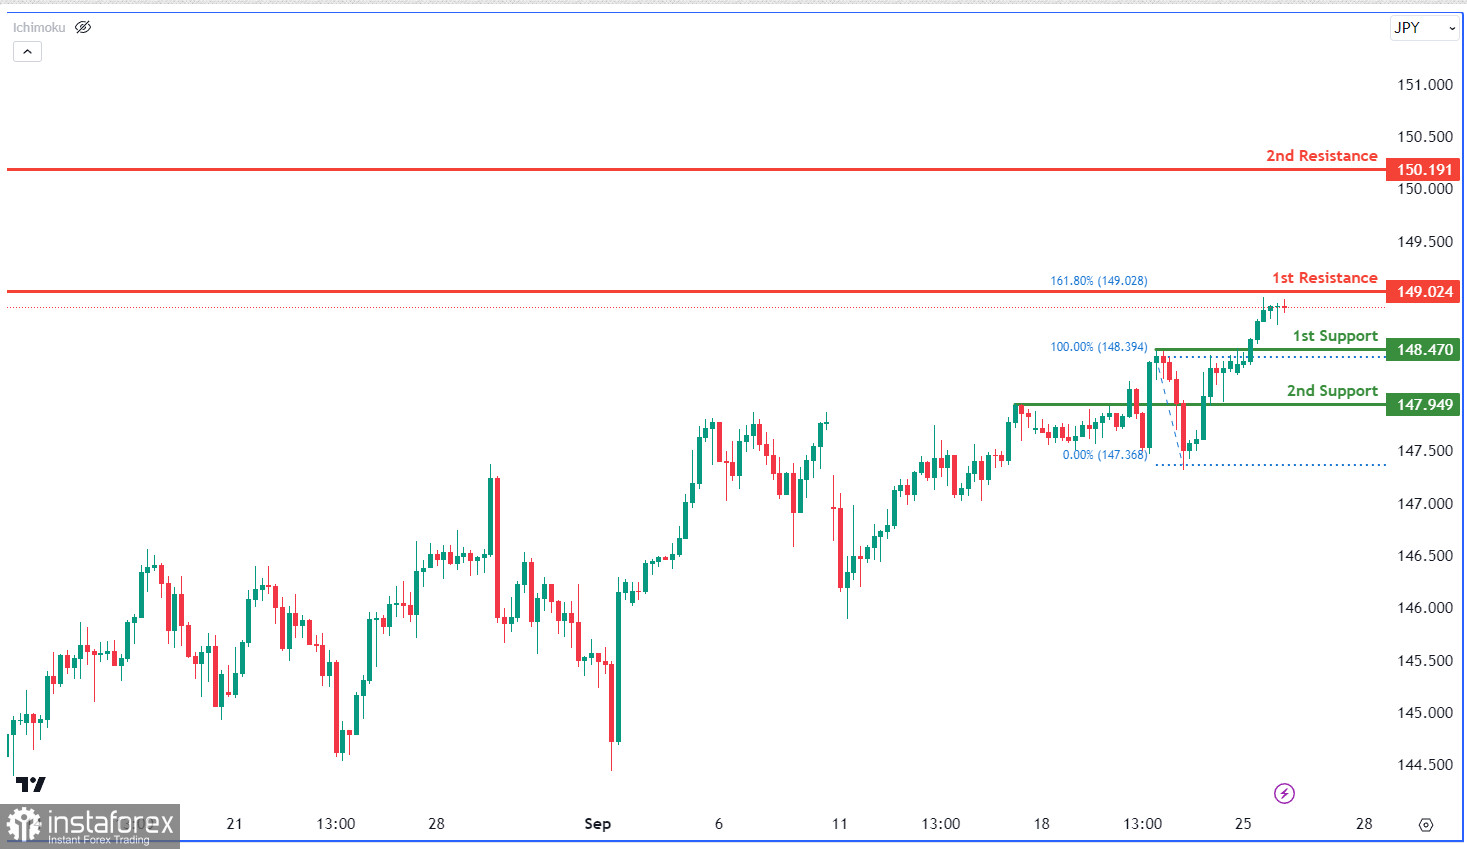
The USD/JPY chart displays a bearish trend. The price might react bearishly at the 1st resistance (149.02) influenced by a swing high and the 161.80% Fibonacci Extension, potentially dropping to the 1st support at 148.47. Another key support is at 147.94, while the 2nd resistance is at 150.19, both highlighting potential reversal points.
 English
 Русский
 Bahasa Indonesia
 Bahasa Malay
 ไทย
ไทย Español
 Deutsch
 Български
 Français
 Tiếng Việt
 中文
中文 বাংলা
বাংলা हिन्दी
 Čeština
 Українська
 Română

