Technical outlook:
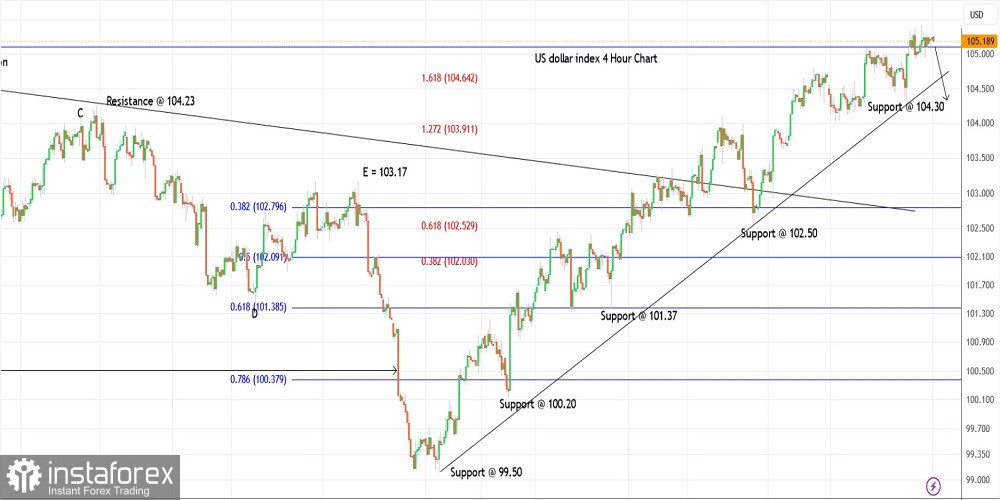
The US dollar index rallied through the 105.41 highs last week before finding resistance. The index is seen to be trading close to 106.20 at this point in writing as the bears prepare to produce a counter-trend drop towards 103.00 soon. A break below its support trend line and the 104.30 initial support will confirm a top in place.
The US dollar index has been rallying since mid-July after printing lows just above 99.00 as seen on the 4H chart here. The above upswing could be seen as the first wave of the corrective phase towards 109.00. A second wave should resume lower towards 103.00 soon before the final push higher towards 109.00 going forward.
The US dollar index has also tested the Fibonacci 0.382 retracement of the entire drop between 114.70 and 99.00 levels respectively. A high probability remains for a pullback from here towards 103.00 at least before the rally could resume. Also, note that 103.00 is the Fibonacci 0.392 retracement of the recent upswing between 99.00 and 105.41 levels respectively.
Trading idea:
A potential drop towards 103.00 to resume soon.
Good luck!
 English
 Русский
 Bahasa Indonesia
 Bahasa Malay
 ไทย
ไทย Español
 Deutsch
 Български
 Français
 Tiếng Việt
 中文
中文 বাংলা
বাংলা हिन्दी
 Čeština
 Українська
 Română

