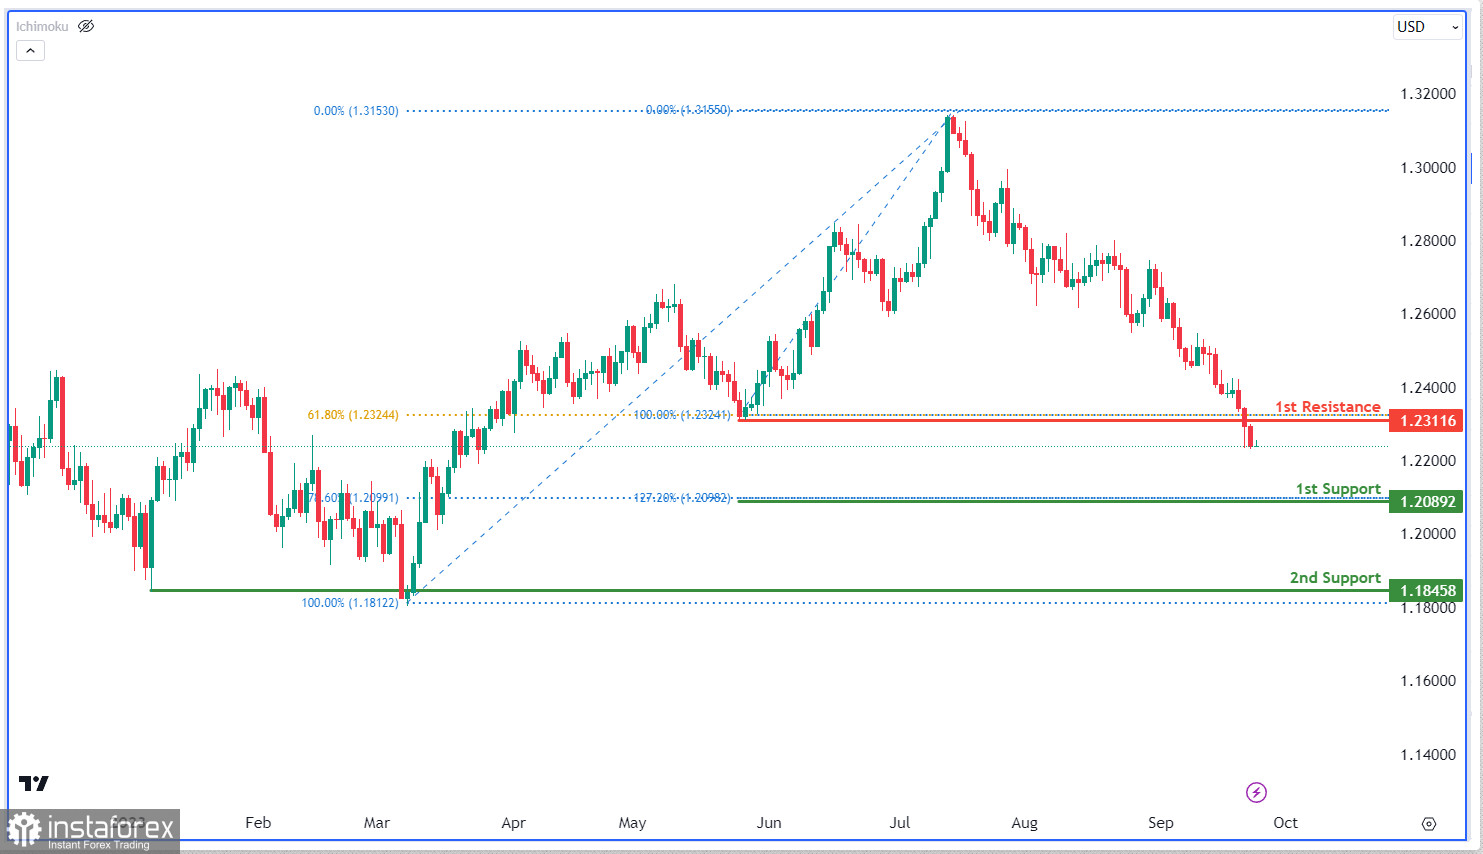
The GBP/USD chart shows a bearish trend, with focus on the 1st support at 1.2089, significant due to the convergence of the 127.20% Fibonacci Extension and the 78.60% Fibonacci Retracement. The 2nd support is at 1.1845, a historical swing low. On the resistance side, the 1st resistance is at 1.2311, a pullback resistance aligned with the 61.80% Fibonacci Retracement, serving as a potential barrier.
 English
 Русский
 Bahasa Indonesia
 Bahasa Malay
 ไทย
ไทย Español
 Deutsch
 Български
 Français
 Tiếng Việt
 中文
中文 বাংলা
বাংলা हिन्दी
 Čeština
 Українська
 Română

