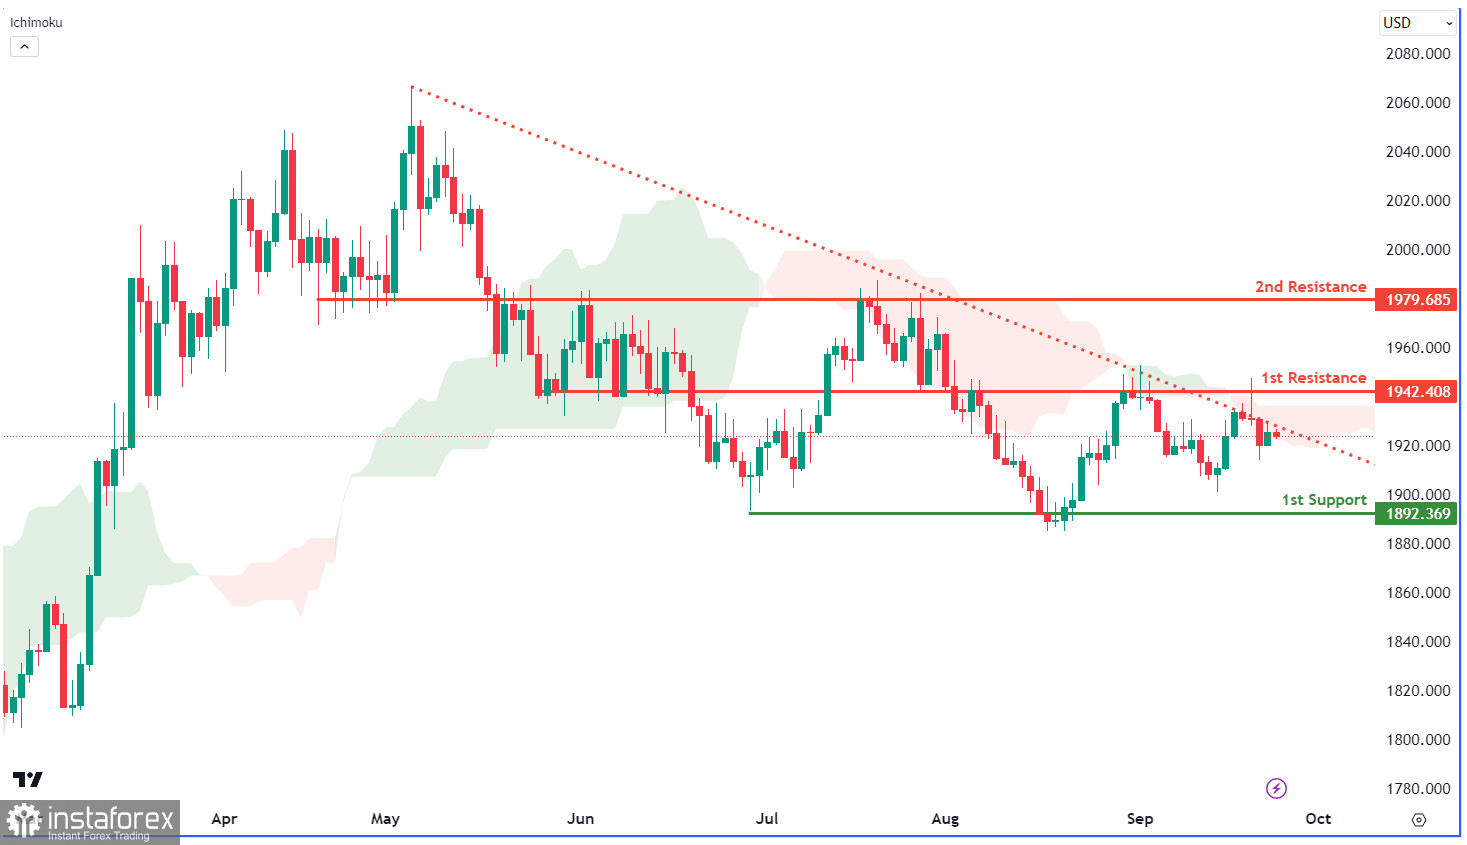
The XAU/USD chart exhibits a bearish trend, influenced by its position below the bearish Ichimoku cloud and a descending trend line. A short-term rise towards the 1st resistance at 1942.40 is possible before a potential decline to the 1st support at 1892.36, an overlap support. Resistance levels include 1942.40 and 1979.68, both marked as overlap resistances
 English
 Русский
 Bahasa Indonesia
 Bahasa Malay
 ไทย
ไทย Español
 Deutsch
 Български
 Français
 Tiếng Việt
 中文
中文 বাংলা
বাংলা हिन्दी
 Čeština
 Українська
 Română

