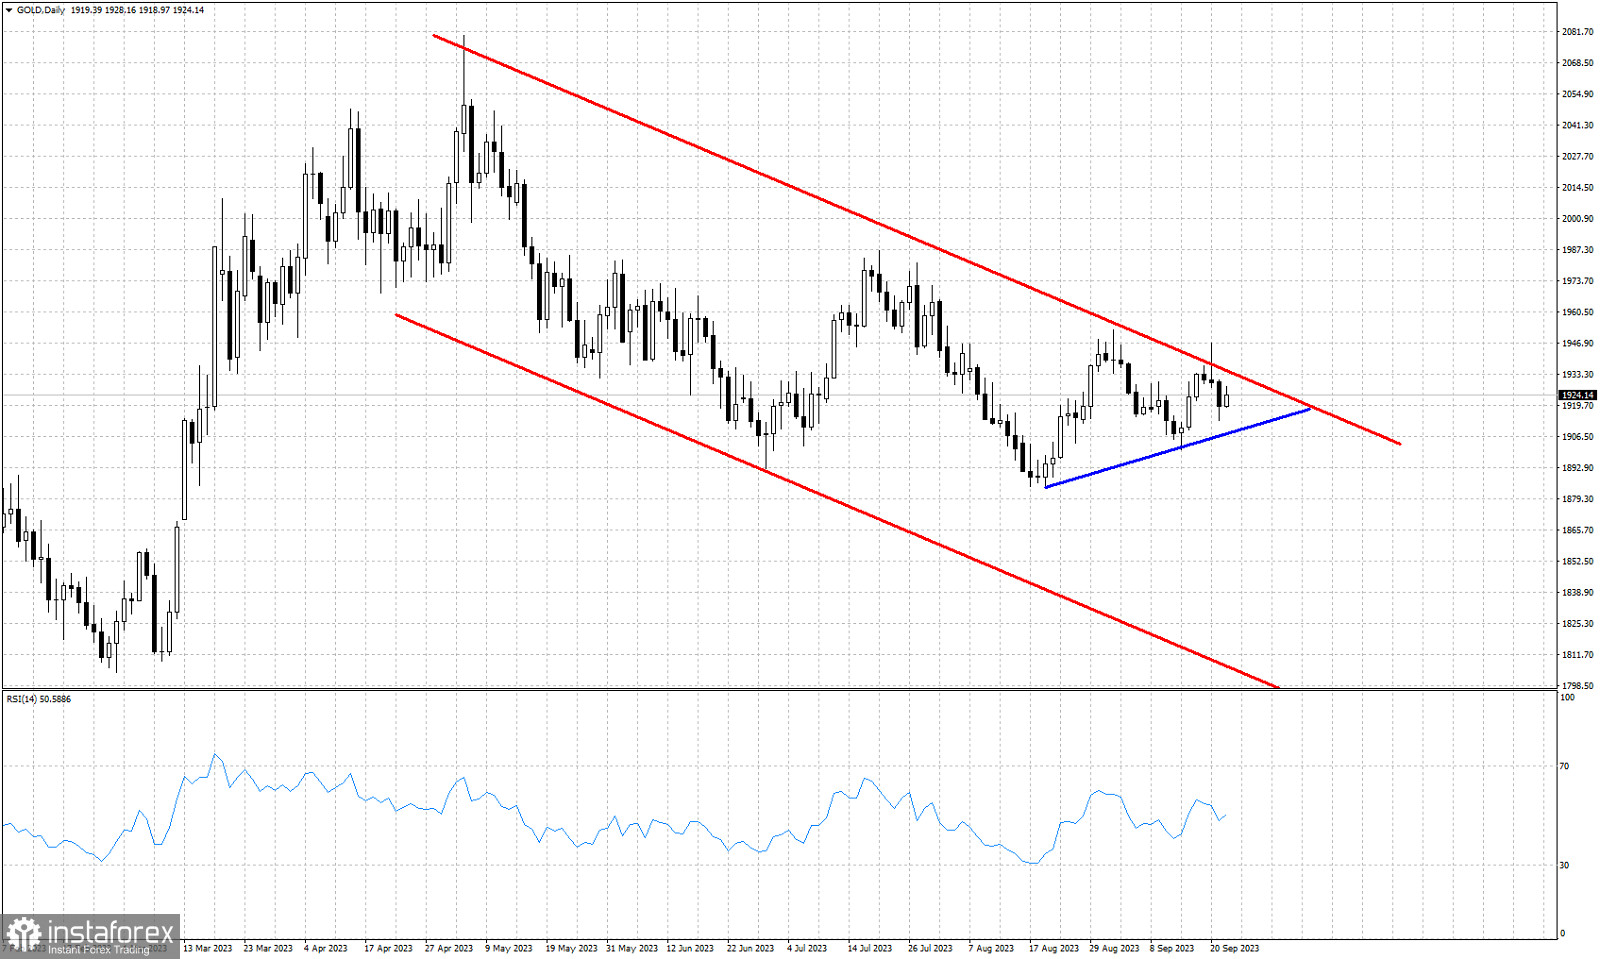
Red lines -bearish channel
Blue line- support trend line
Gold price is trading around $1,925. Price is still inside the red downward sloping channel. Yesterday price tested the upper channel resistance and got rejected. Price remains above the blue upward sloping near term support trend line. Support by the blue trend line is found at $1,907. A break below this level will open the way for a move to new lows below $1,884. Gold price is in the early stages of forming a triangle pattern as price is mostly moving sideways over the last few sessions. Lower highs and higher lows are seen since August 21st. Traders should keep a close eye on $1,907 and $1,937.
 English
 Русский
 Bahasa Indonesia
 Bahasa Malay
 ไทย
ไทย Español
 Deutsch
 Български
 Français
 Tiếng Việt
 中文
中文 বাংলা
বাংলা हिन्दी
 Čeština
 Українська
 Română

