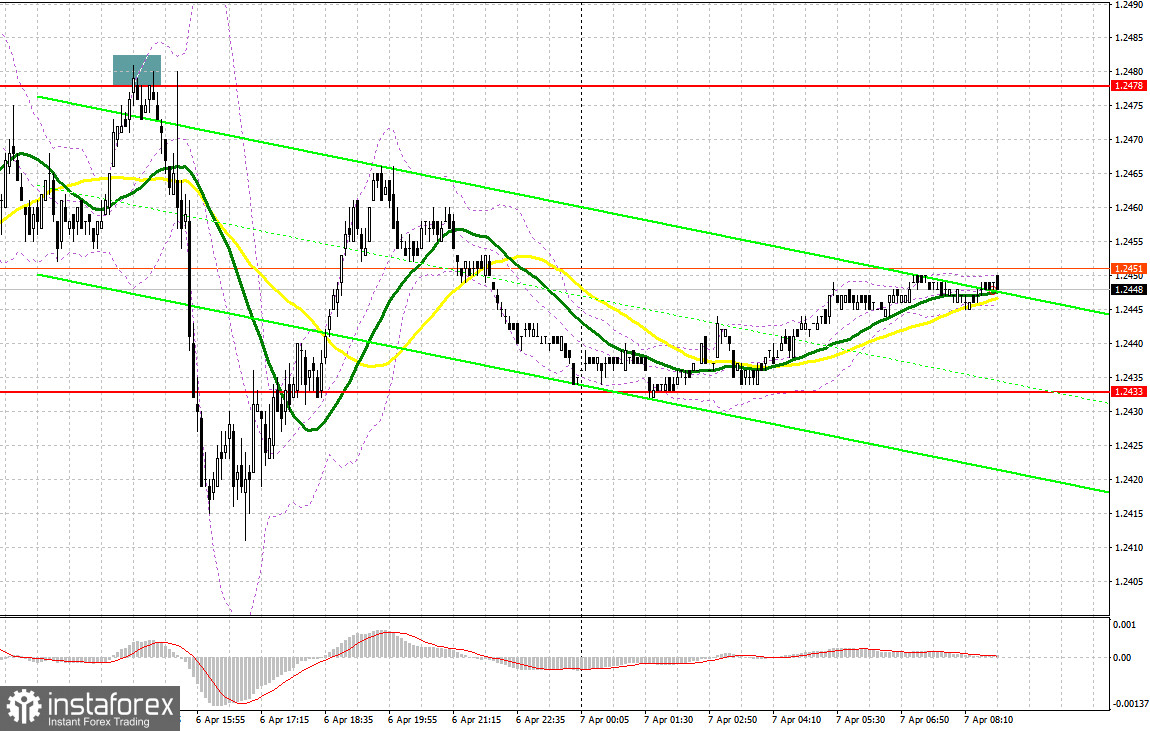
Yesterday, only one market entry signal was formed. I suggest taking a look at the 5-minute chart to understand what happened there. In my morning forecast, I mentioned the level of 1.2460 and recommended making market entry decisions from it. A breakout of this level did not create a buy signal as there were no buyers during a retest at 1.2460. Subsequently, the price fell below this range, and we had to review the technical picture for the second half of the day. During the American session, a rise and a false breakout at 1.2478 provided a good entry point for selling the pound, which then resulted in a decline of more than 45 pips.

To open long positions on GBP/USD:
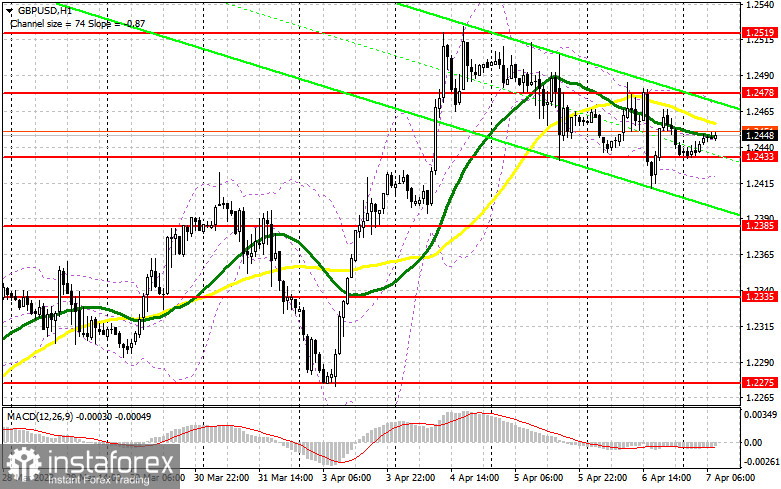
Today, there is no important fundamental data for the UK in the first half of the day. So it will be difficult for pound buyers to regain control of the market. Therefore, the focus will be on US statistics and market reaction to the jobs data. For now, it is better to focus on the 1.2433 level. A decline and the formation of a false breakout there would confirm the presence of buyers in the market, providing a good signal to open long positions with a return to resistance at 1.2478 that was formed yesterday. A breakout and a downward test of this area will create another entry point for long positions with the prospect of returning to the monthly high around 1.2519, where I recommend taking profits. The ultimate target is the 1.2551 area. In a scenario where the price declines to 1.2433 and there is no bullish activity, it is better not to rush with purchases. In this case, I will open long positions only on a false breakout in the next support area of 1.2385. I plan to buy GBP/USD immediately on the bounce from the low of 1.2335, bearing in mind a correction of 30-35 pips within the day.
To open short positions on GBP/USD:
Sellers need to assert their strength around 1.2478. Only a false breakout there will provide a chance to continue the downward correction with the prospect of reaching 1.2433. A breakout and an upward retest of this range will increase pressure on the pound, creating a sell signal with a drop to 1.2385. This will be a strong enough correction to disrupt the uptrend. The furthest target remains at the low of 1.2335. If the price tests this level, this will cancel the plans of the bulls. If GBP/USD rises and there is no activity at 1.2478, which is also quite likely, it is better to postpone sales until the quote tests the monthly high at 1.2519 and until the US labor market data is out. Only a false breakout there will provide an entry point into short positions. If there is no downward movement there, I will sell GBP/USD on a rebound immediately from the high of 1.2551, bearing in mind an intraday correction of 30-35 pips.

COT report
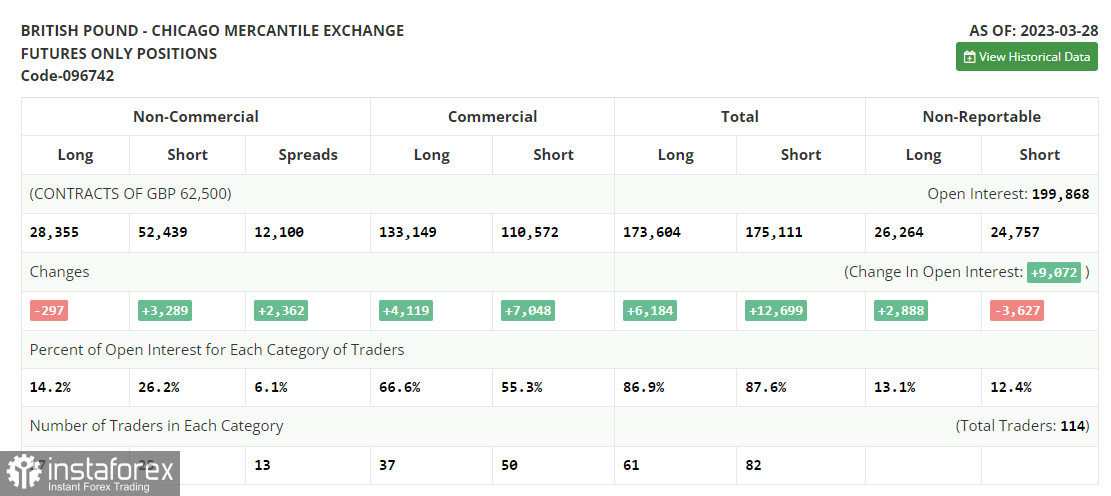
The Commitments of Traders report for March 28 recorded a drop in both long and short positions. In fact, there are no significant changes in the market balance. The released data on the upwardly revised UK GDP growth for the 4th quarter was enough for the pound to hold near its monthly highs and return to them at the beginning of this month. The statements made by Andrew Bailey, the Governor of the Bank of England, increased expectations of a further rate hike, which played in favor of the buyers. The latest COT report states that short non-commercial positions increased by 3,289 to 52,439, while long non-commercial positions decreased by 297 to 28,355, resulting in an increase in the negative value of the non-commercial net position to -24,084 from -20,498 a week earlier. The weekly closing price rose to 1.2358 from 1.2241.

Indicator signals:
Moving Averages
Trading near the 30- and 50-day moving averages indicates a range-bound market ahead of important publications
Please note that the time period and levels of the moving averages are analyzed only for the H1 chart, which differs from the general definition of the classic daily moving averages on the D1 chart.
Bollinger Bands
If the pair declines, the lower band of the indicator at 1.2420 will serve as support.
Description of indicators:
• A moving average of a 50-day period determines the current trend by smoothing volatility and noise; marked in yellow on the chart;
• A moving average of a 30-day period determines the current trend by smoothing volatility and noise; marked in green on the chart;
• MACD Indicator (Moving Average Convergence/Divergence) Fast EMA with a 12-day period; Slow EMA with a 26-day period. SMA with a 9-day period;
• Bollinger Bands: 20-day period;
• Non-commercial traders are speculators such as individual traders, hedge funds, and large institutions who use the futures market for speculative purposes and meet certain requirements;
• Long non-commercial positions represent the total number of long positions opened by non-commercial traders;
• Short non-commercial positions represent the total number of short positions opened by non-commercial traders;
• The non-commercial net position is the difference between short and long positions of non-commercial traders.
 English
 Русский
 Bahasa Indonesia
 Bahasa Malay
 ไทย
ไทย Español
 Deutsch
 Български
 Français
 Tiếng Việt
 中文
中文 বাংলা
বাংলা हिन्दी
 Čeština
 Українська
 Română

