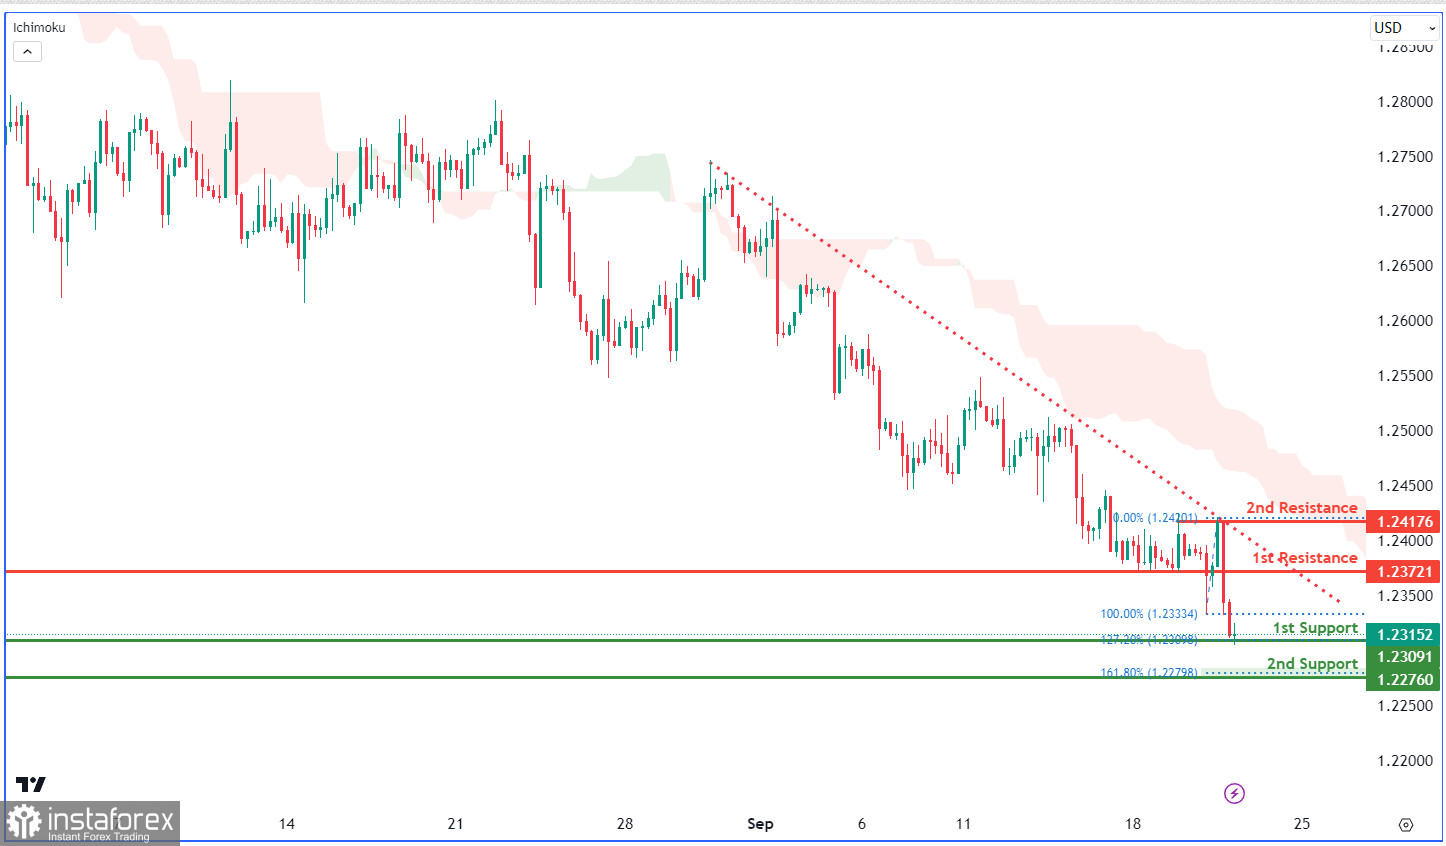
The GBP/USD chart displays a bearish trend, driven by its position below a descending trend line. It may briefly rise to the 1st resistance at 1.2372 before falling towards the 1st support at 1.2309, which is a swing low support aligning with the 127.20% Fibonacci Extension. The 2nd support is at 1.2276, aligning with the 161.80% Fibonacci Extension. On the resistance side, the primary level is at 1.2372, with the 2nd resistance at 1.2417, emphasizing their importance.
 English
 Русский
 Bahasa Indonesia
 Bahasa Malay
 ไทย
ไทย Español
 Deutsch
 Български
 Français
 Tiếng Việt
 中文
中文 বাংলা
বাংলা हिन्दी
 Čeština
 Українська
 Română

