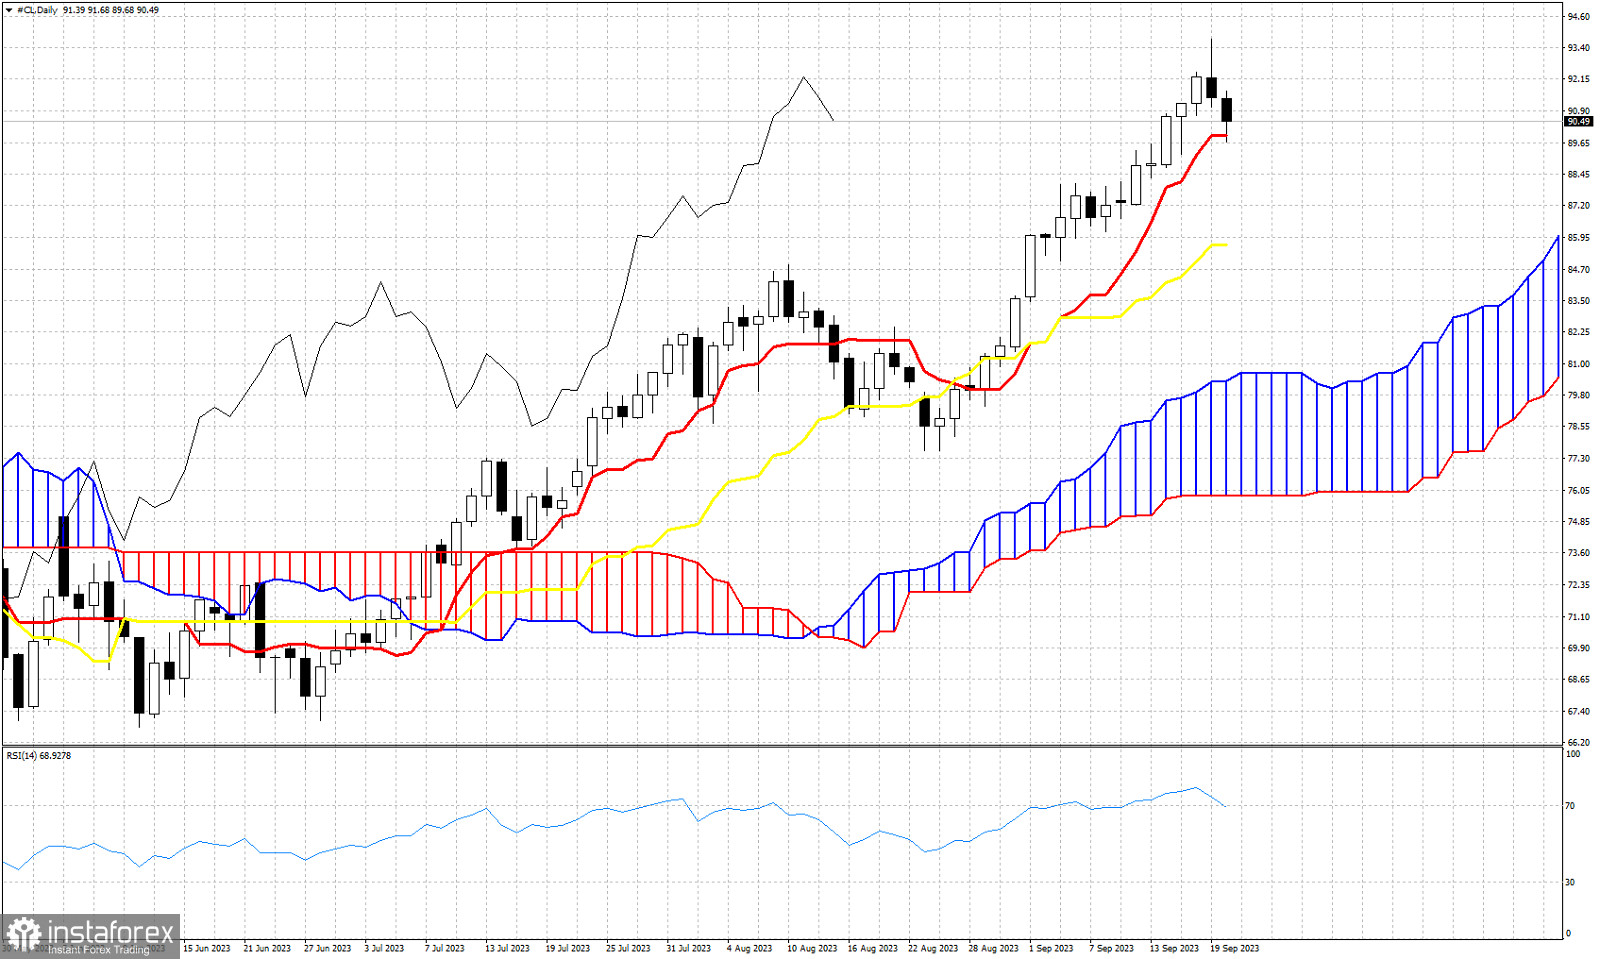
Oil price is trading around $90.50. As we mentioned in our previous analysis on Oil using the Ichimoku cloud indicator, short-term support is found at $90 and a break below this level could start a bigger pull back. We also noted that the extended upward move in Oil price justifies now at least a minor pull back. For a second day Oil prices are under pressure. Thus far there is no change in the Daily chart. Trend remains bullish and there is no sign of a reversal. The Chikou span (black line indicator) remains above the candlestick pattern (bullish) and price above both the tenkan-sen (red line indicator) and the kijun-sen (yellow line indicator). The RSI is turning lower from overbought levels. Today's low tested the tenkan-sen support. A break to new lower lows will be a sign of weakness. We continue to believe that Oil price is vulnerable to a pull back.
 English
 Русский
 Bahasa Indonesia
 Bahasa Malay
 ไทย
ไทย Español
 Deutsch
 Български
 Français
 Tiếng Việt
 中文
中文 বাংলা
বাংলা हिन्दी
 Čeština
 Українська
 Română

