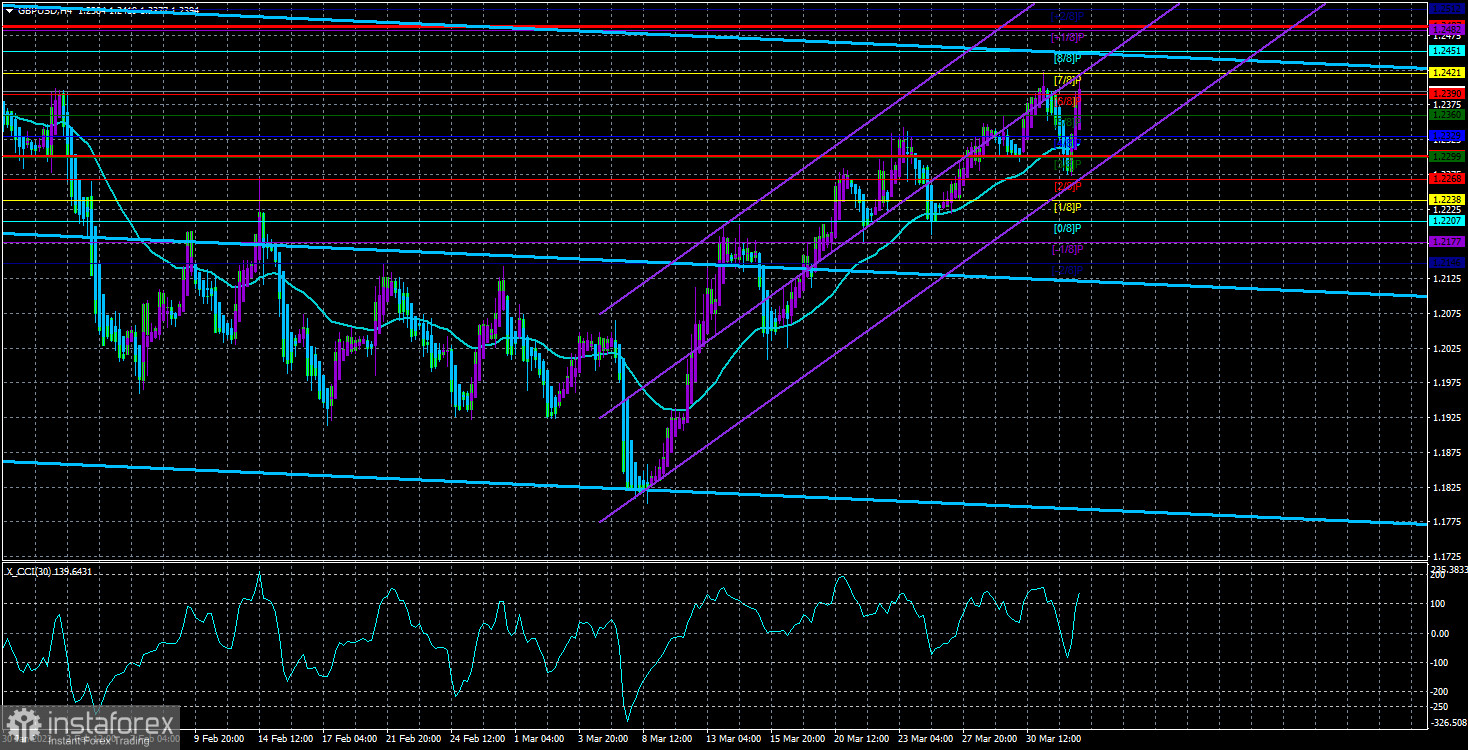
On Monday, the GBP/USD currency pair was also actively traded. In addition, it is nearly comparable to the EUR/USD pair. As previously stated, the fundamental backdrop was nearly the same for both pairs, and it was evident that this was not the cause of the movements we eventually observed. And the pound, which was fixed below the moving average, spent at most ten hours in this area. It practically moved upward and returned to its local highs on Monday. Hence, we can only assume that the upward trend is contained within the side channel between 1.1840 and 1.2440. Notwithstanding the deterioration of the side channel's upper limit, the decline of the British pound has been postponed once more. The most intriguing aspect is that there were no valid causes for the pound's 600-point gain. Additionally, a rebound from the lower boundary of the side channel at 1.1840 preceded it logically. There are currently a large number of contradictory factors on the market. We anticipate a decline in the British pound because it is close to 1.2440. If this level is overcome, it will be reasonable to expect the continuation of the baseless and inertial rising movement. No one knows how long this will last. So, the current market scenario is not the most straightforward and understandable.
Macroeconomic indicators did not generate such a swing in the pair. It was simply absent last week. Those few reports failed to elicit a market reaction and could not account for the pound's sharp increase. Today, there were no significant data. The sole exception is the ISM index in the United States, which was released almost in the evening and thus could not influence the market during the first eighteen hours of the week. On a 24-hour TF, the situation is as straightforward as possible. The side channel is intact. A decline from 1.2440 to 1.1840 is a rebound. Overcoming 1.2440 represents a new peak.
The euro was expected to decline, while the dollar was anticipated to rise.
OPEC's decision to reduce oil production on the opening trading day of the week was the most intriguing information. In truth, this is not the first decision of this nature. OPEC nations can influence the price of oil, which they do frequently. Logically, everyone desires to maximize their resources' profitability. Hence, such a decision was hardly a "thunderbolt from the clear sky" for us. Moreover, should we find a correlation between the OPEC decision and Monday's strengthening of the euro and the pound? Remember that the United States is virtually self-sufficient in oil and even sells part of it to foreign markets. So, OPEC's decision, which may lead to an increase in oil prices in the future, is also advantageous for the United States. Yet, the European Union imports the majority of oil. Thus, these are additional expenses and a budgetary burden for the European Union. Nonetheless, the euro rose on Monday, and the British pound likewise increased.
So, we do not correlate OPEC's decision with Monday's foreign exchange market activity. Given that the market has been purchasing just euros and the pound recently, ignoring all other variables, it is no surprise that it has resumed its favorite activity at the start of the new week. Regrettably, there is no sense in the current movements, and fixing below the moving has no significance. Yet there is also some good news: the pound's future fate should be determined at 1.2440. After the price moves away from it (from either side), the next move of the pound/dollar pair should become clearer.

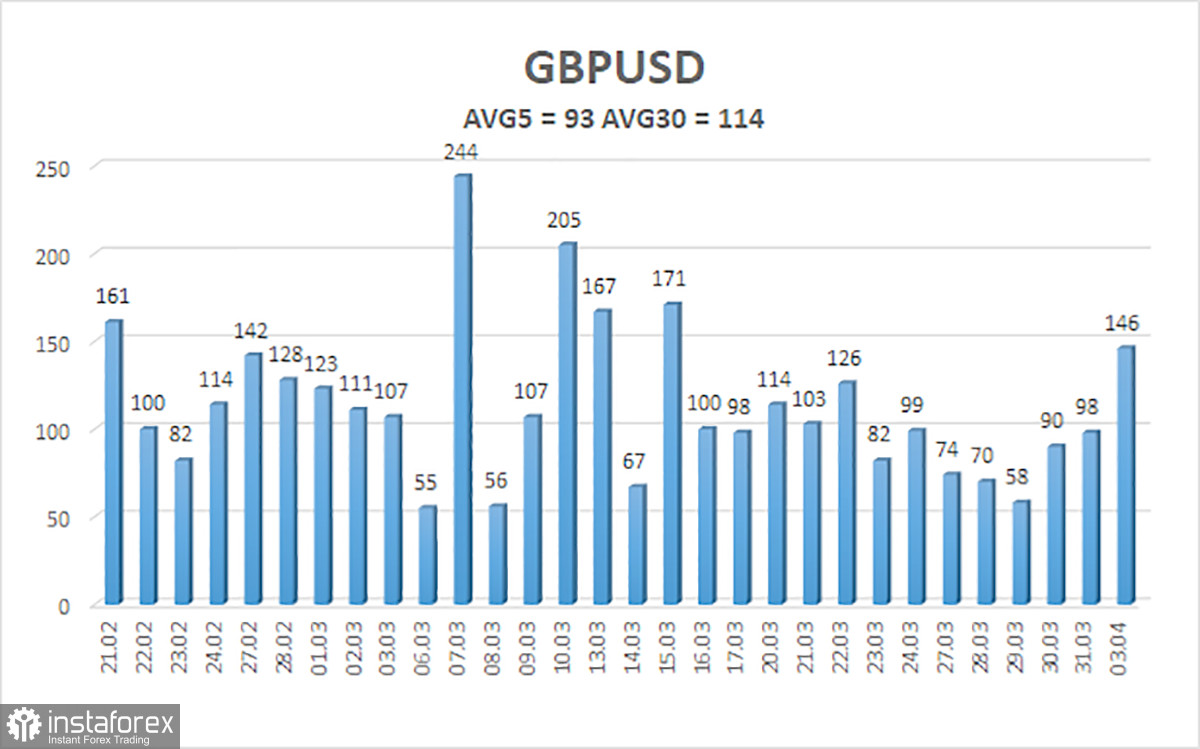
The average five-day volatility of the GBP/USD pair is 93 points. This value for the pound/dollar pair is "average." As a result, on Tuesday, April 4, we anticipate activity within the channel, with 1.2301 and 1.2487 as its limits. A reversal of the Heiken Ashi indicator in the downward direction will signal a new round of downward movement.
Nearest support levels:
S1 – 1.2360
S2 – 1.2329
S3 – 1.2299
Nearest resistance level:
R1 – 1,2390
R2 – 12421
R3 – 1.2451
Trading Recommendations:
In the 4-hour time frame, the GBP/USD pair has consolidated back above the moving average line. Until the Heiken Ashi indicator turns down, you should maintain long positions with targets between 1.2421 and 1.2451. If the price settles below the moving average, short positions can be considered with targets of 1.2268 and 1.2338.
Explanations for the illustrations:
Channels of linear regression – aid in determining the present trend. If both move in the same direction, the trend is strong.
Moving average line (settings 20.0, smoothed) – determines the current short-term trend and trading direction.
Murray levels serve as movement and correction targets.
Volatility levels (red lines) represent the expected price channel the pair will trade within over the next trading day based on the current volatility indicators.
The CCI indicator — its entry into the oversold area (below -250) or the overbought area (above +250) indicates that a trend reversal is imminent.
 English
 Русский
 Bahasa Indonesia
 Bahasa Malay
 ไทย
ไทย Español
 Deutsch
 Български
 Français
 Tiếng Việt
 中文
中文 বাংলা
বাংলা हिन्दी
 Čeština
 Українська
 Română

