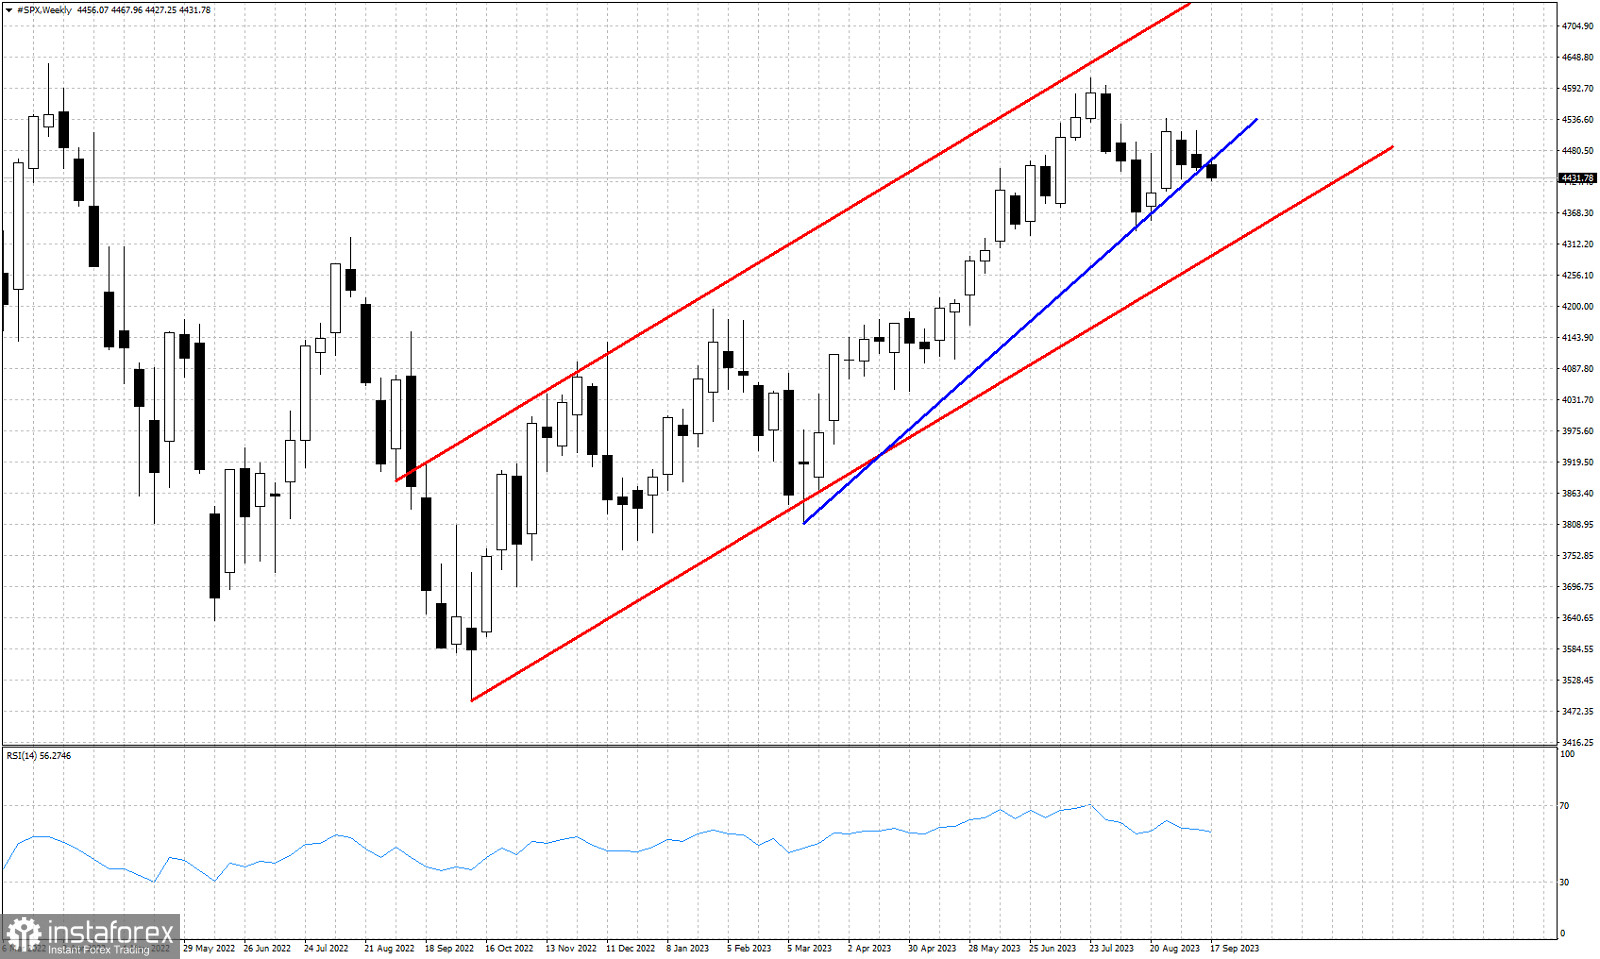
Blue line- support trend line
Red lines- bullish channel
SPX is trading around 4,430. In the weekly chart we see price breaking below the blue upward sloping support trend line. Although the week is not over yet, I believe there are increased chances that the index will remain under pressure and price will fall towards the lower channel boundary. SPX remains inside the medium-term upward sloping channel. In previous posts we talked about the vulnerability of the index and the increased chances of a bigger pull back and a test of the channel boundary. Next key support is at 4,336 recent low. A break below this level will push price towards 4,300 and the lower channel boundary. In fact as long as we trade below 4,516 we expect SPX to remain under pressure.
 English
 Русский
 Bahasa Indonesia
 Bahasa Malay
 ไทย
ไทย Español
 Deutsch
 Български
 Français
 Tiếng Việt
 中文
中文 বাংলা
বাংলা हिन्दी
 Čeština
 Українська
 Română

