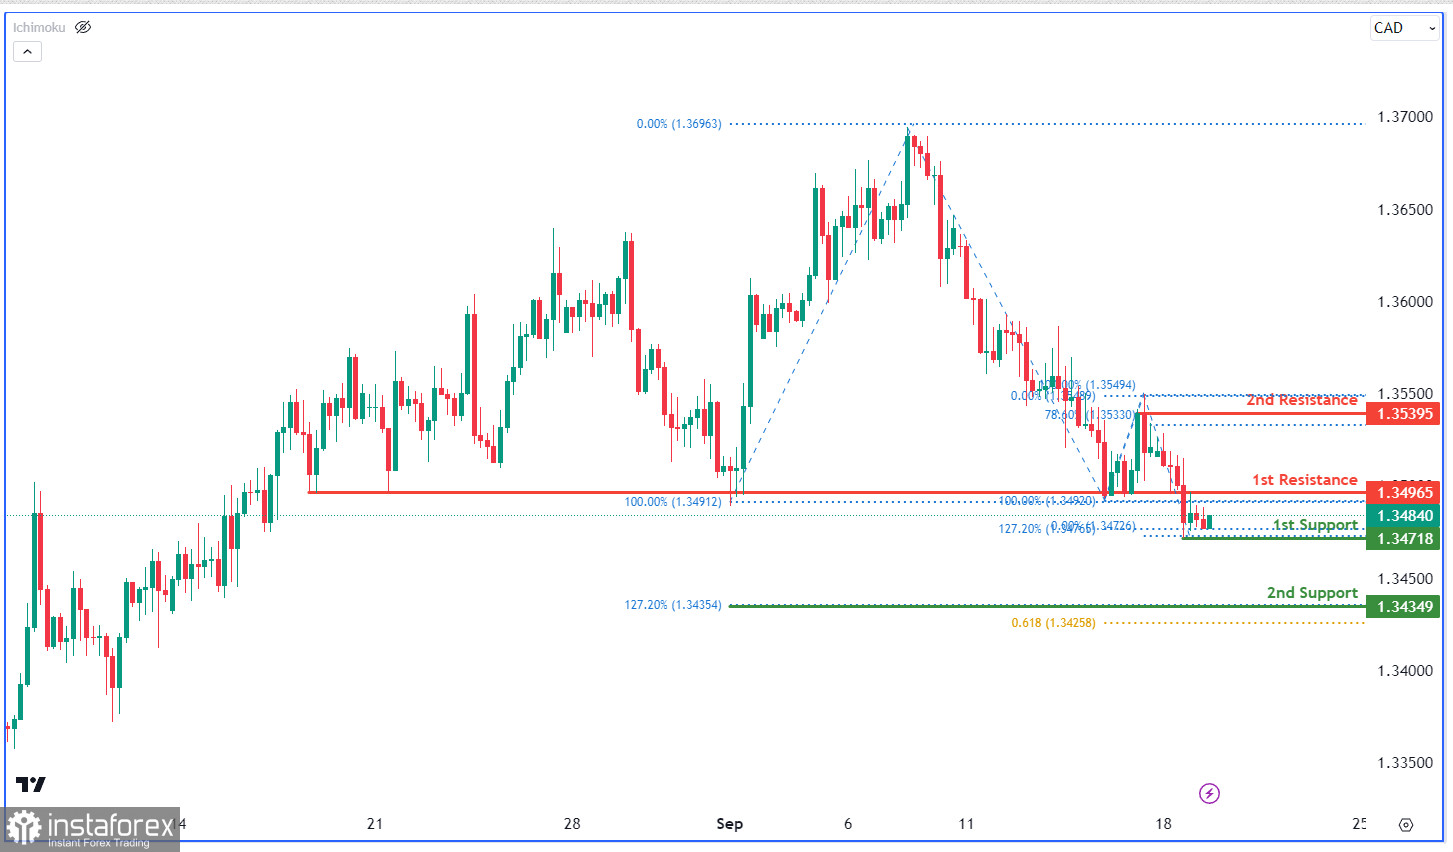
The USD/CAD chart displays a neutral trend, suggesting price may range between the 1st support and resistance. The 1st support at 1.3472 aligns with the 127.20% Fibonacci extension, while the 2nd support at 1.3435 coincides with multiple Fibonacci levels. On the upside, resistances are at 1.3497 (pullback resistance) and 1.3539, which is a swing-high resistance matched with the 78.60% Fibonacci retracement.
 English
 Русский
 Bahasa Indonesia
 Bahasa Malay
 ไทย
ไทย Español
 Deutsch
 Български
 Français
 Tiếng Việt
 中文
中文 বাংলা
বাংলা हिन्दी
 Čeština
 Українська
 Română

