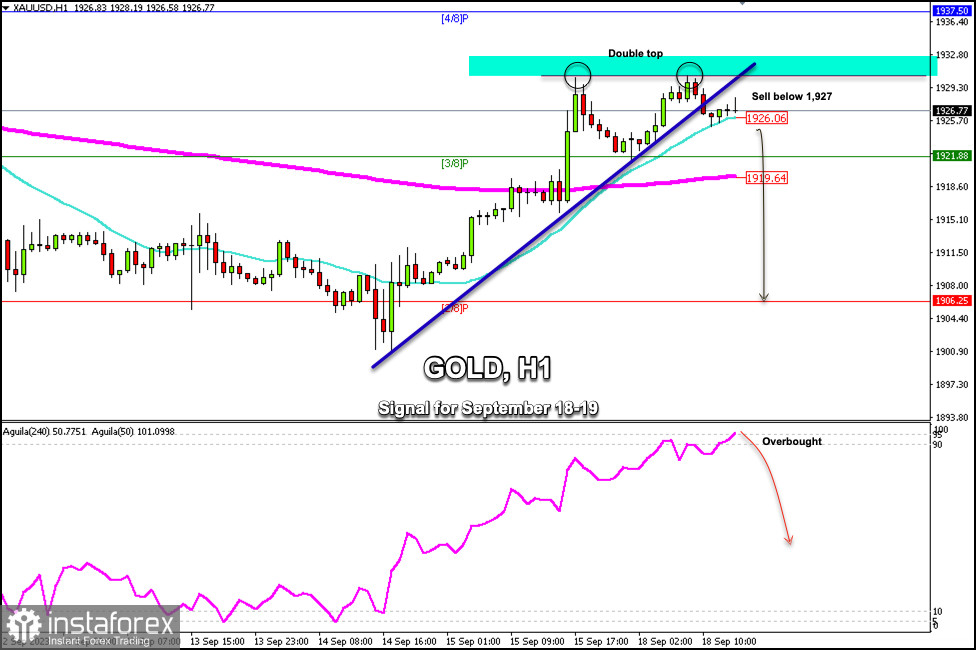
Early in the American session, gold (XAU/USD) was trading around 1926.77 above the 21 SMA and below the uptrend channel formed on September 14.
In the H-1 chart, during the European session, we could see that gold reached the resistance of 1930, forming a double-top technical reversal pattern. This level represents a strong resistance zone.
In the next few hours, we could expect that if the XAU/USD falls and consolidates below this level, a bearish acceleration could occur towards the 200 EMA located at 1,919 and it could even reach the support of 2/8 Murray located in 1,906.
As gold trades below 1,937 (4/8 Murray), the pressure will remain bearish for gold, meaning any technical bounce toward this area could be seen as an opportunity to sell.
The trend in gold could change, as this week investors will be attentive to the latest monetary policy update from the Federal Reserve (Fed). However, no changes are expected, so it is likely that gold will resume its technical correction and it could fall back to the psychological level of 1,900.
However, markets are still pricing in the possibility of a 0.25% rise by the end of this year, between November and December. This factor could limit gold's strength and could keep it under bearish pressure.
In case the XAU resumes its bullish cycle, we could expect it to consolidate above 1,937 (4/8 Murray). The key will be to wait for a weekly close above this zone, and then gold could reach 1,965 and even the psychological level of $2,000.
The eagle indicator on the H-1 chart reached the extreme overbought zone around 95 points. This means that an imminent correction could occur in the next few hours and gold could fall towards support levels of 1,921 (3/8 Murray) and even to 1,919 (200 EMA).
 English
 Русский
 Bahasa Indonesia
 Bahasa Malay
 ไทย
ไทย Español
 Deutsch
 Български
 Français
 Tiếng Việt
 中文
中文 বাংলা
বাংলা हिन्दी
 Čeština
 Українська
 Română

