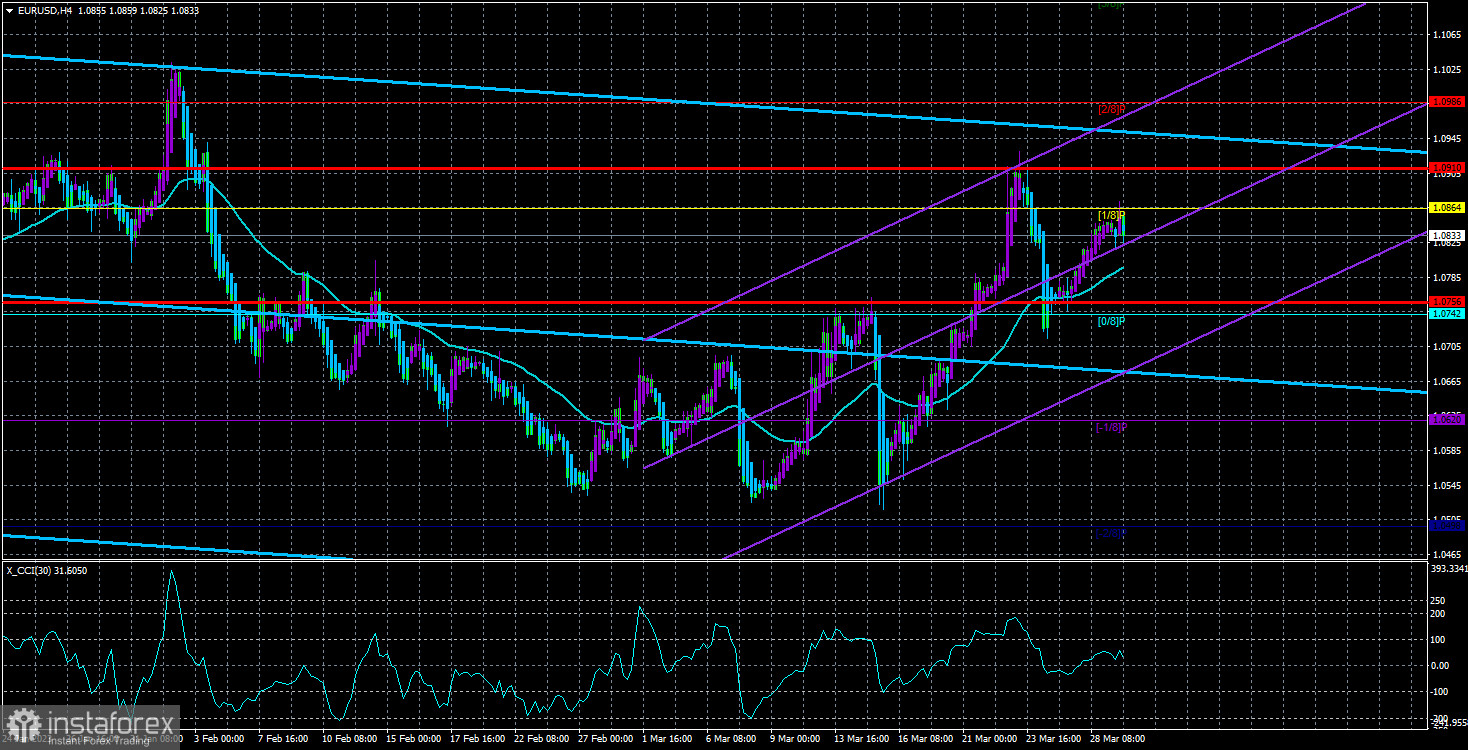
The EUR/USD currency pair reached the Murray level of "1/8" (1.0864) on Wednesday once more, but this time it was unable to pass it and is now ready to start a round of downward movement. Given that neither the euro nor the dollar should currently be in a better position, we continue to think that a "swing" is the most probable scenario for the course of the event. We are still struggling to comprehend what caused the European currency to increase by 410 points. Therefore, it will not be unexpected if the pair breaks through the moving average line before the end of the working week and then continues to fall until it reaches the level of 1.0500.
We've discussed rates before, but we'll go over them again quickly. In 2023, the ECB might increase interest rates more aggressively than the Fed, which might catalyze the euro's future growth. Over the last six months, the European currency has already increased by 1,500 points. The Fed will also not stand idly by and may raise monetary pressure at the first hint of a slowdown in the rate of falling inflation. The 2.5% increase in EU inflation suggests a stronger ECB rate rise, but in the US, inflation has slowed by 3% over the past eight months at a higher pace. If the Fed's rate is currently 5%, the ECB's rate needs to be raised to 6-6.5% to achieve results in the near future. Does anyone think that will happen? As a result, we think that the rate differential between the ECB and the Fed has yet to be resolved, implying that the European currency does not have many grounds for strong growth.
On the 24-hour TF, the couple keeps moving up and down, which once again relates to the idea of "swing." Long-term proximity of the price to the Ichimoku indicator's pivotal lines increases the likelihood of a flat. We still recommend another round of movement to the south in the long term because a significant downward correction has not taken place.
On Thursday, the week's first results will be released.
Finally, traders will start to obtain macroeconomic data today. But it won't even come close to being the most crucial. Everything begins with the release of Germany's March inflation rate. You should pay attention to this indicator because Germany is the "locomotive" of the European economy. It is anticipated that the consumer price index will decrease from 8.7% y/y to 7.3-7.5% y/y. In our opinion, this is an overly optimistic situation, and the decline will be less severe. By the way, the ECB now considers core inflation in Germany to be of the utmost importance, even though it is not publicly available. In general, German inflation is significant, but the report on European inflation, which will be published on Friday, is more significant. These two reports might provoke a strong response.
The final assessment of the US GDP for the fourth quarter will be the second "report of the day." Experts predict that the economy will grow by 3.9%, which is only marginally less than the third quarter's worth (+4.4% q/q). This report is unlikely to provoke a strong response; it is more background information. In other words, market participants will be able to recognize that the American economy is still strong and that the Fed has the option to continue tightening monetary policy if inflation unexpectedly begins to slow in its decline. They are prepared for a value of +3.9%, though, so even a small difference from the predicted value is unlikely to shock the market enough to cause a decline or increase in the value of the dollar.
The market may therefore respond to today's reports, but it won't likely be in a significant way. Everything will be more influenced by market sentiment and "technique." The alternative with a 200–300 point loss is now, in our opinion, the best one.

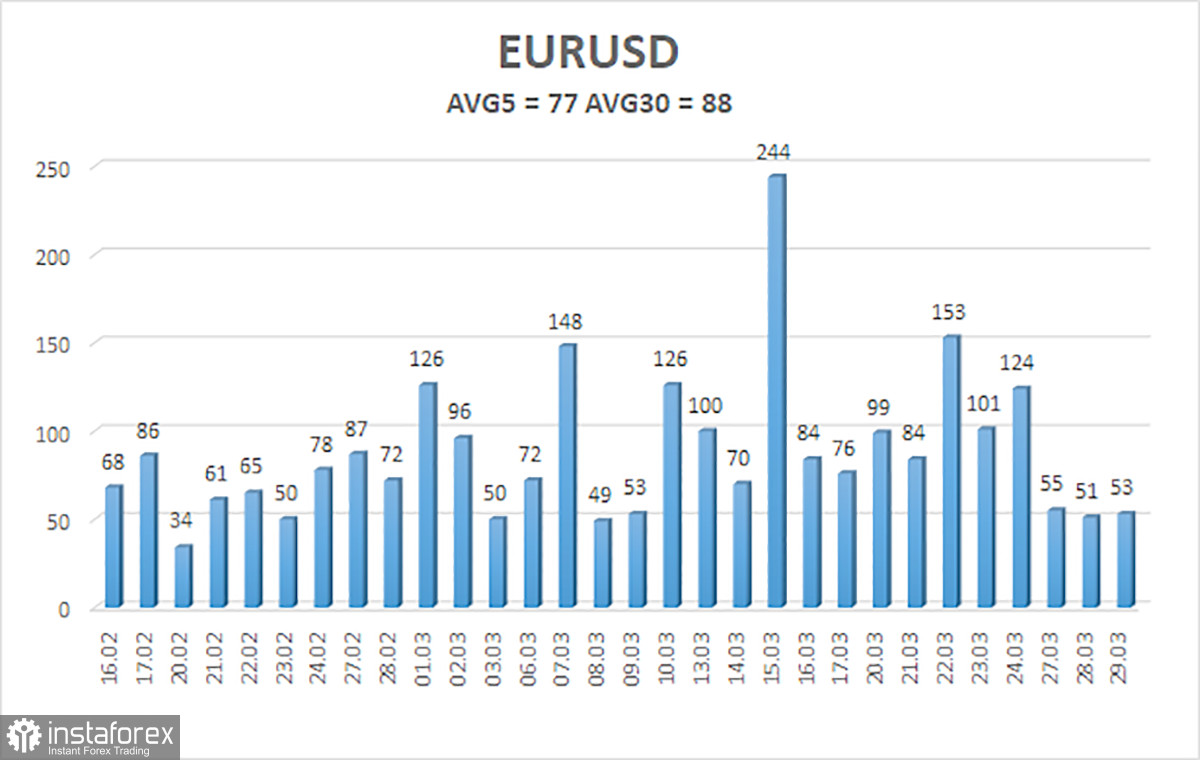
As of March 30, the euro/dollar currency pair's average move over the previous five trading days was 77 points, which is considered "average." So, on Thursday, we anticipate the pair will move between 1.0756 and 1.0910 values. A new round of downward movement will be signaled by the Heiken Ashi indicator reversing lower.
Nearest levels of support
S1 – 1.0742
S2 – 1.0620
S3 – 1.0498
Nearest levels of resistance
R1 – 1.0864
R2 – 1.0986
R3 – 1.1108
Trading Suggestions:
The EUR/USD pair is attempting to increase its upward movement. Until the Heiken Ashi indicator goes down, you can continue holding long positions with targets of 1.0864 and 1.0910. After the price is fixed below the moving average line, short positions can be opened with a target of 1.0620.
explanations for the illustrations:
Determine the present trend with the use of linear regression channels. The trend is now strong if they are both moving in the same direction.
The short-term trend and how to trade right now are determined by the moving average line (settings 20.0, smoothed).
Murray levels serve as the starting point for adjustments and movements.
Based on current volatility indicators, volatility levels (red lines) represent the expected price channel in which the pair will trade the following day.
A trend reversal in the opposite direction is imminent when the CCI indicator crosses into the overbought (above +250) or oversold (below -250) zones.
 English
 Русский
 Bahasa Indonesia
 Bahasa Malay
 ไทย
ไทย Español
 Deutsch
 Български
 Français
 Tiếng Việt
 中文
中文 বাংলা
বাংলা हिन्दी
 Čeština
 Українська
 Română

