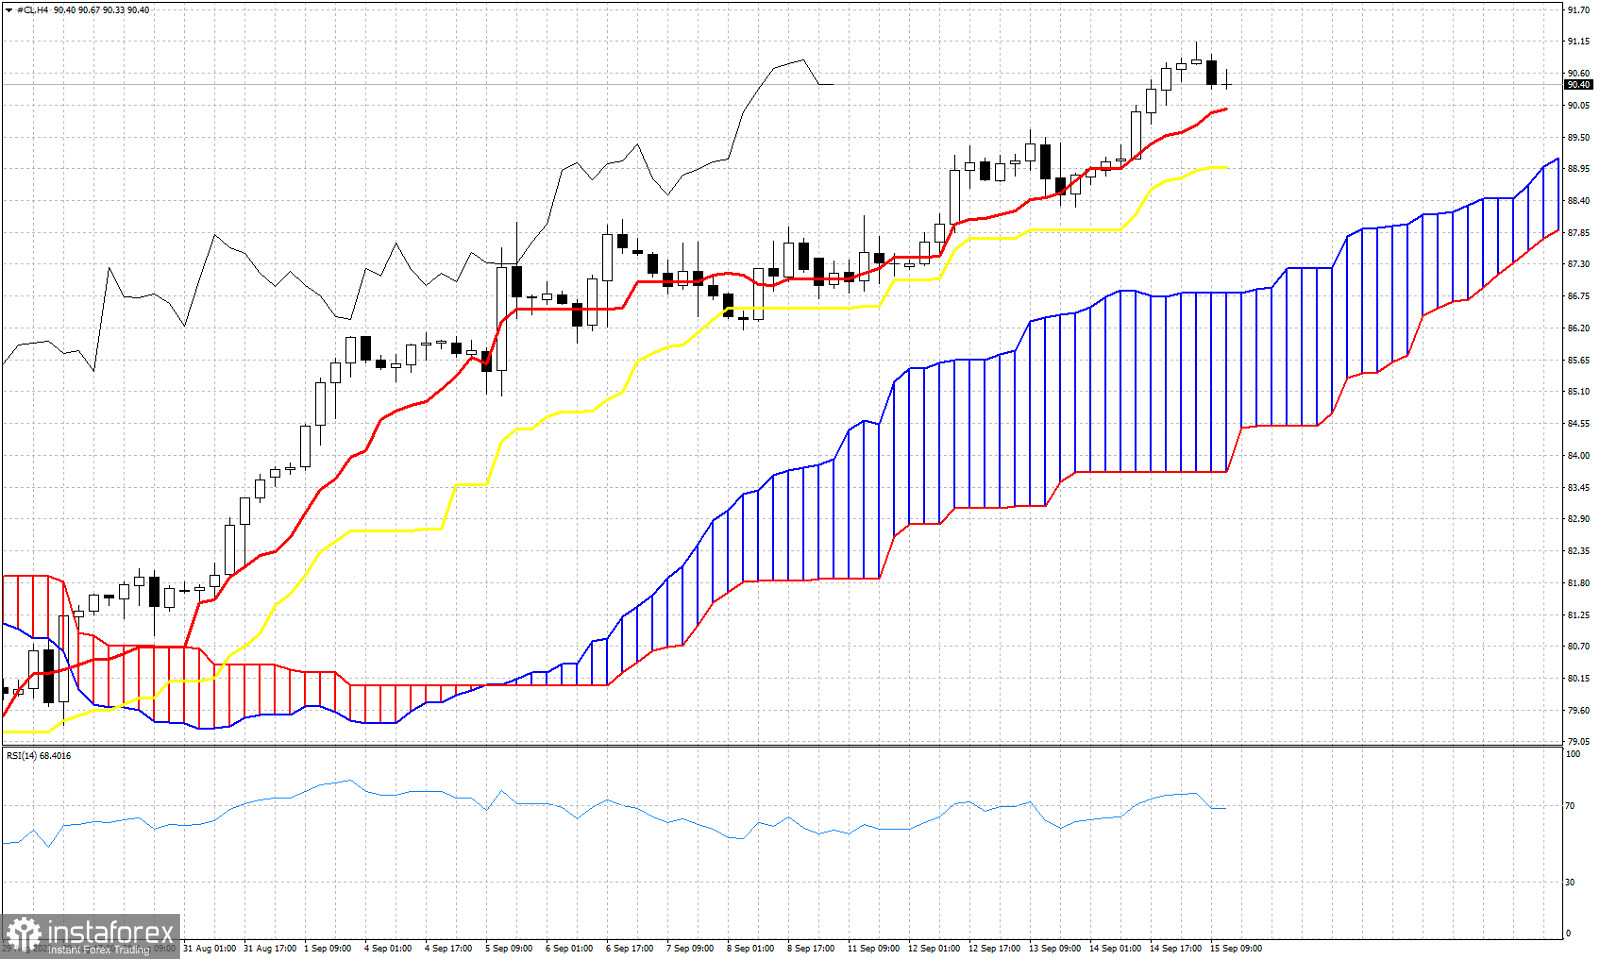
Oil price is in a bullish trend according to the Ichimoku cloud indicator. We use this indicator to identify key support levels that if broken we could get reversal signals. Over the last two candlesticks price seems to be under pressure. After such a long bull run, a pull back is justified. The tenkan-sen (Red line indicator) provides support at $89.98 and the kijun-sen (yellow line indicator) at $88.97. The Chikou span (black line indicator) is above the candlestick pattern (bullish). The Chikou span suggests that support is at $88. So a break below the tenkan-sen could be the start of a bigger pull back. Failure to hold above the kijun-sen will lead to a deeper pull back towards the Kumo support at $87.
 English
 Русский
 Bahasa Indonesia
 Bahasa Malay
 ไทย
ไทย Español
 Deutsch
 Български
 Français
 Tiếng Việt
 中文
中文 বাংলা
বাংলা हिन्दी
 Čeština
 Українська
 Română

