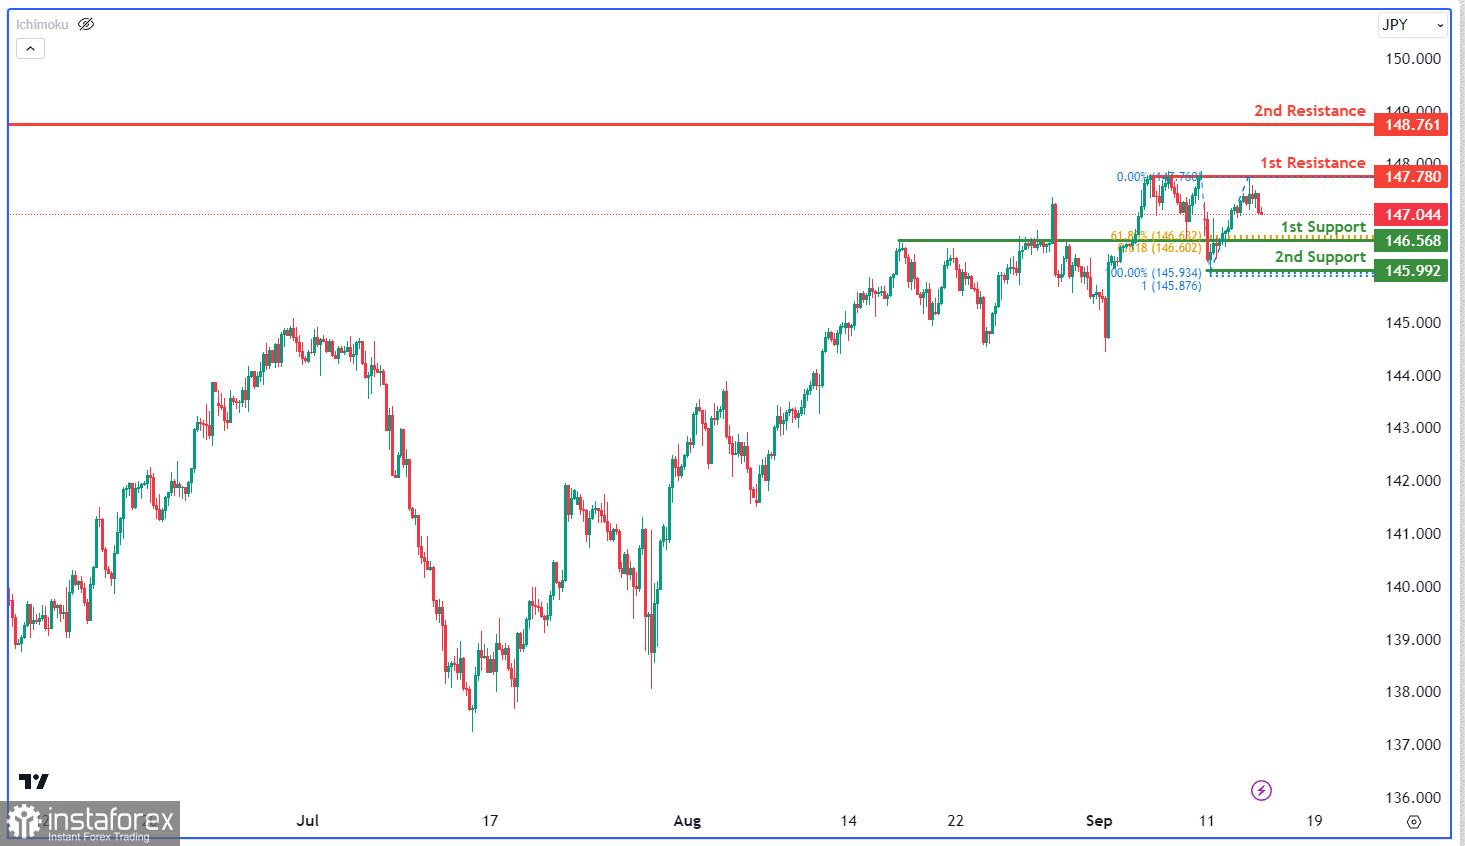
The USD/JPY chart shows bearish momentum, indicating a potential downtrend. There's a chance the price could continue lower to the 1st support at 146.56, which aligns with a swing low support, 61.80% Fibonacci Projection, and 61.80% Fibonacci Retracement, forming a strong support zone. The 2nd support at 145.99 is a multi-swing low support, further reinforcing its support role. On the resistance side, the 1st resistance at 147.78 is significant as a multi-swing high resistance, while the 2nd resistance at 148.76 is a swing high resistance.
 English
 Русский
 Bahasa Indonesia
 Bahasa Malay
 ไทย
ไทย Español
 Deutsch
 Български
 Français
 Tiếng Việt
 中文
中文 বাংলা
বাংলা हिन्दी
 Čeština
 Українська
 Română

