 English
  Русский
 Bahasa Indonesia
 Bahasa Malay
 ไทย
ไทย Español
 Deutsch
 Български
 Français
 Tiếng Việt
 中文
中文 বাংলা
বাংলা हिन्दी
 Čeština
 Українська
 Română

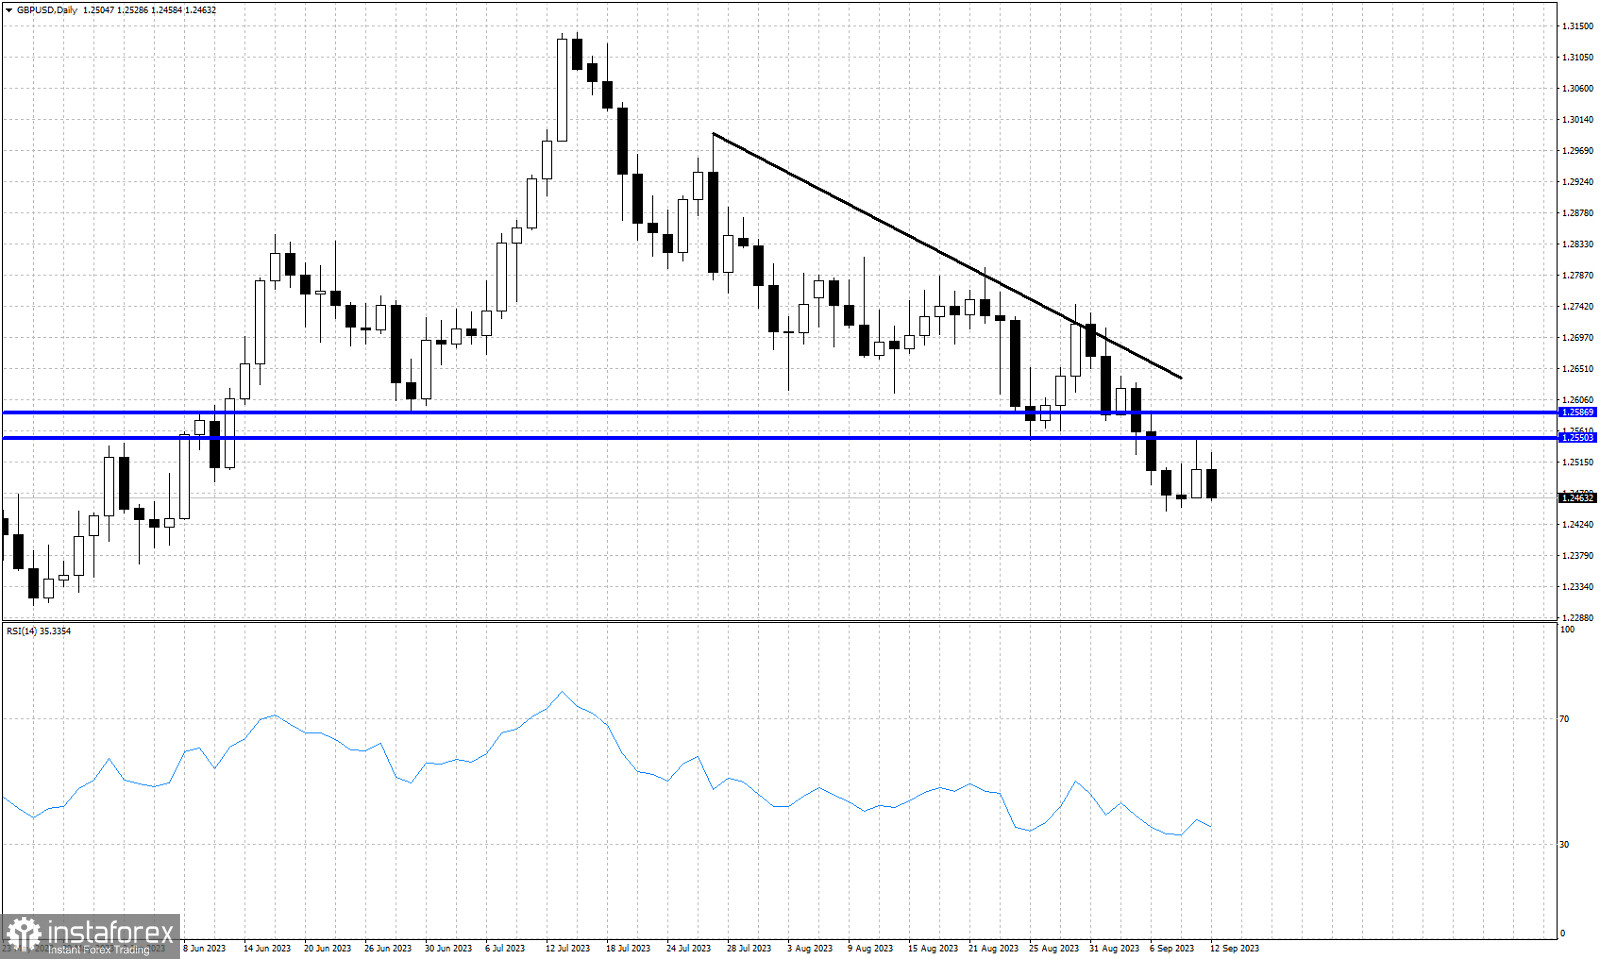
Black line -resistance trend line
Blue lines- previous support levels now resistance
GBPUSD remains under pressure. After making a low around 1.2445, price bounced back towards the horizontal blue lines. These blue lines used to be horizontal support levels. They are now resistance levels. In the near term trend remains bearish as long as price continues making lower lows and lower highs. So 1.2550-1.2585 is our shprt-term resistance level that needs to be broken in order for bulls to hope for a reversal. If combined with a break above the black trend line, then this could be the start of a trend reversal. Until then bears remain in control.