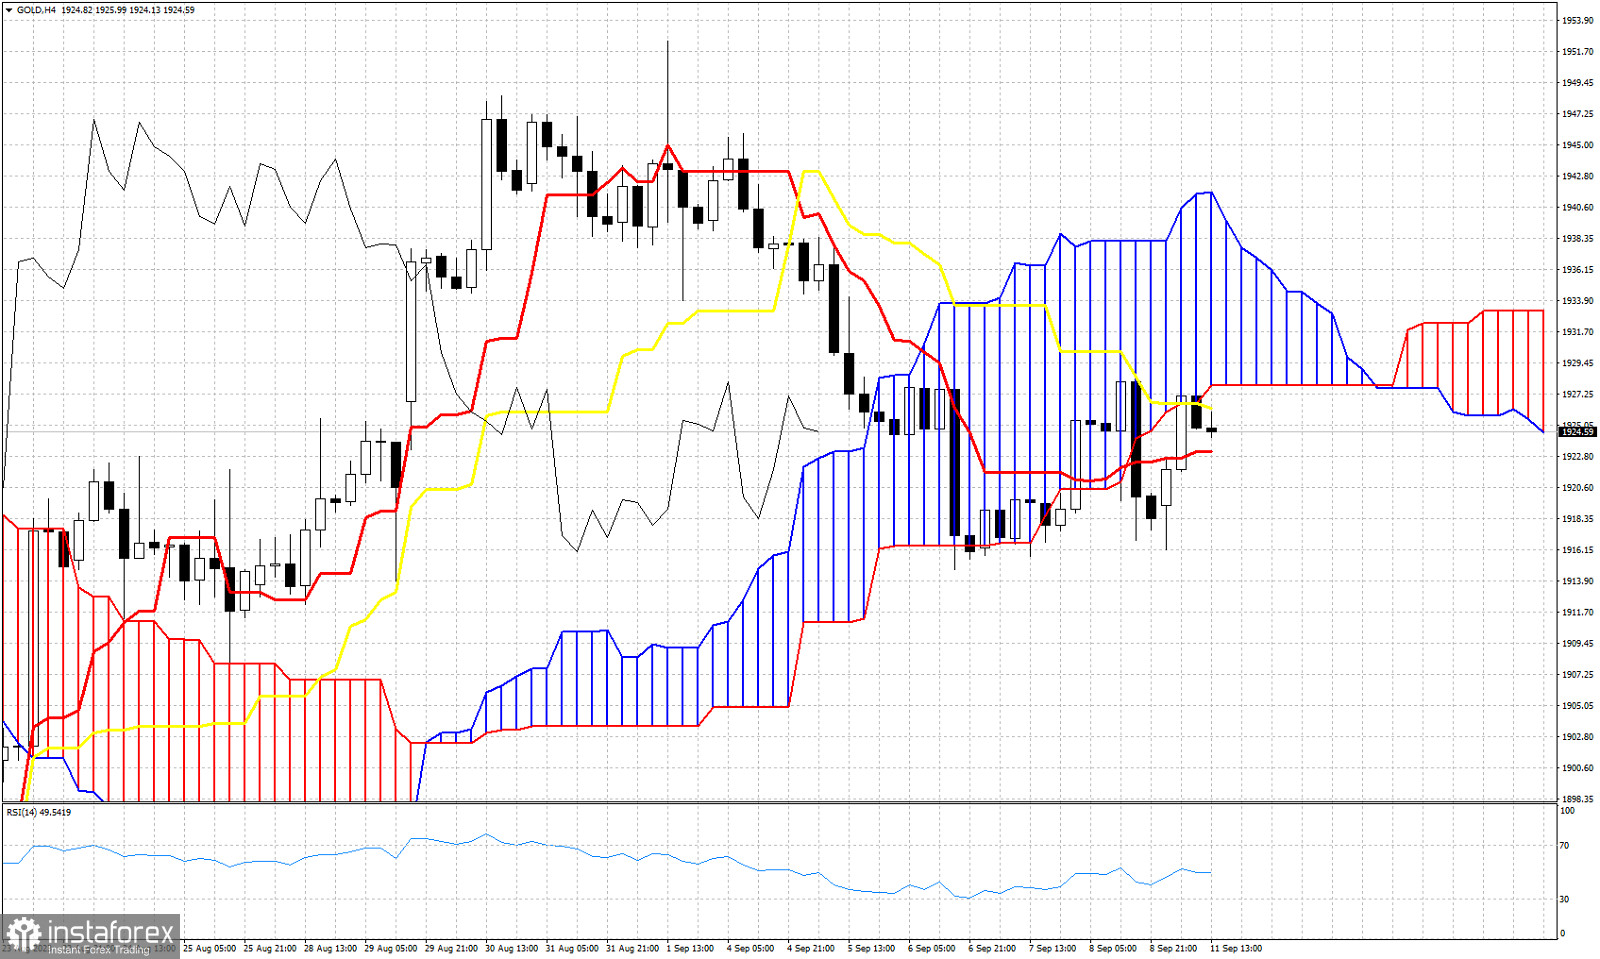
Gold price is trading around $1,925. According to the Ichimoku cloud indicator in the 4 hour chart, trend is bearish as price remains below the 4hour Kumo (cloud). Price is already making an attempt to break inside the Kumo. With the kijun-sen (yellow line indicator) providing resistance at $1,926 and the lower cloud boundary at $1,928, resistance in the area around $1,927 is key. Price is trading above the tenkan-sen (red line indicator) but the Chikou span (black line indicator) remains below the candlestick pattern (bearish). The Ichimoku cloud indicator remains mostly bearish and if price gets rejected at $1,927, we should expect more downside. Bulls need to recapture $1,928 and push price above the cloud in order to reclaim control of the trend.
 English
 Русский
 Bahasa Indonesia
 Bahasa Malay
 ไทย
ไทย Español
 Deutsch
 Български
 Français
 Tiếng Việt
 中文
中文 বাংলা
বাংলা हिन्दी
 Čeština
 Українська
 Română

