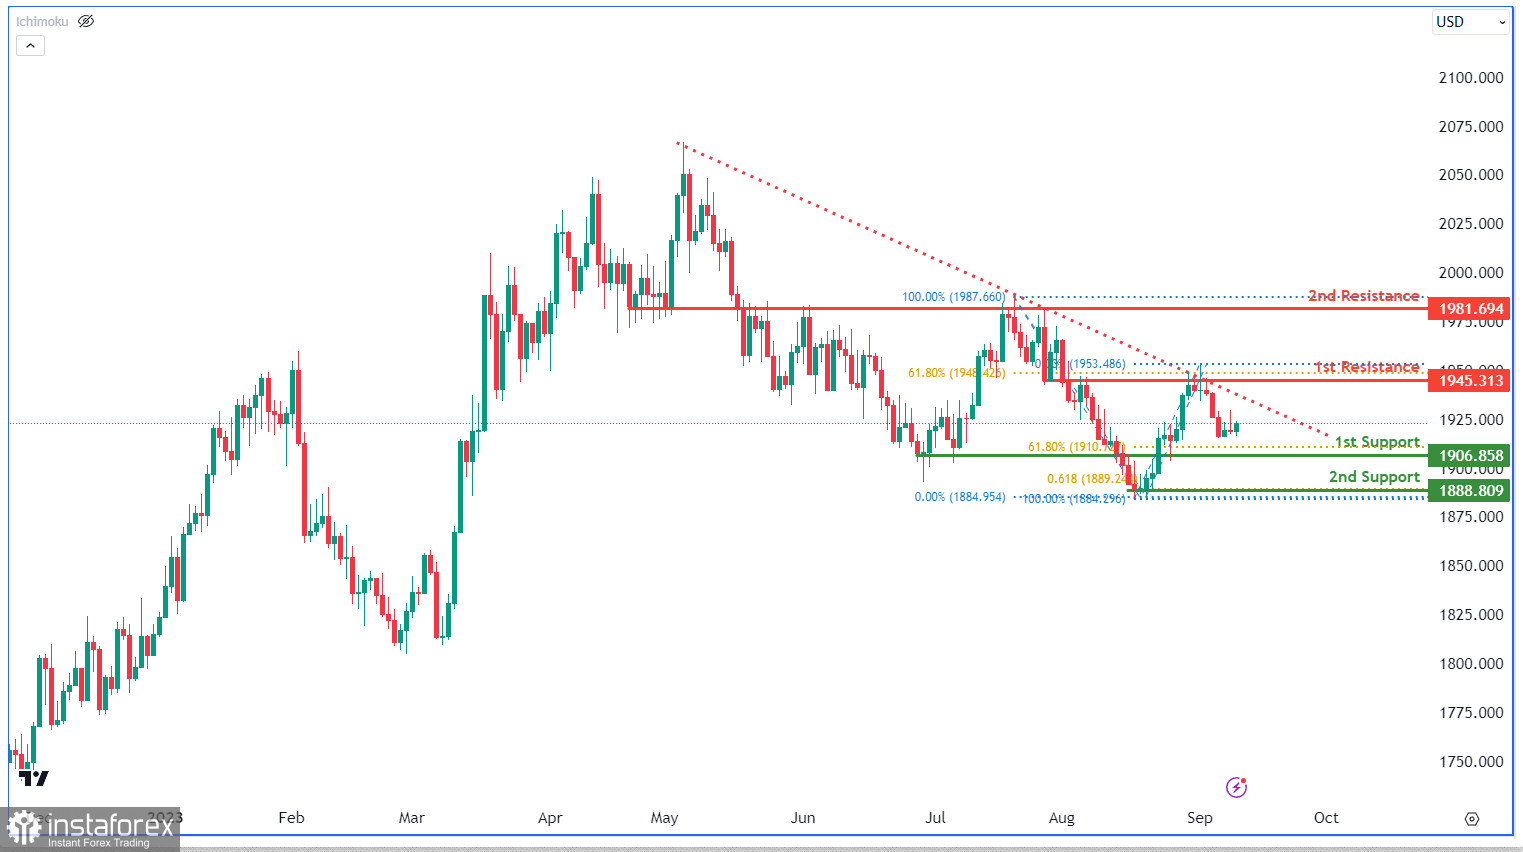
The XAU/USD chart currently shows bearish momentum, supported by being below a major descending trend line. There's a chance of a short-term price rise to the first resistance at 1945.31 before a possible reversal towards the first support. The first support at 1906.85 is significant, aligning with the 61.80% Fibonacci Retracement. Another support at 1888.80 aligns with the 78.60% Fibonacci Retracement, further reinforcing its role. On the resistance side, the first resistance at 1945.31 is marked as an overlap resistance. The second resistance at 1981.69 is also an overlap resistance, suggesting potential resistance in that area.
 English
 Русский
 Bahasa Indonesia
 Bahasa Malay
 ไทย
ไทย Español
 Deutsch
 Български
 Français
 Tiếng Việt
 中文
中文 বাংলা
বাংলা हिन्दी
 Čeština
 Українська
 Română

