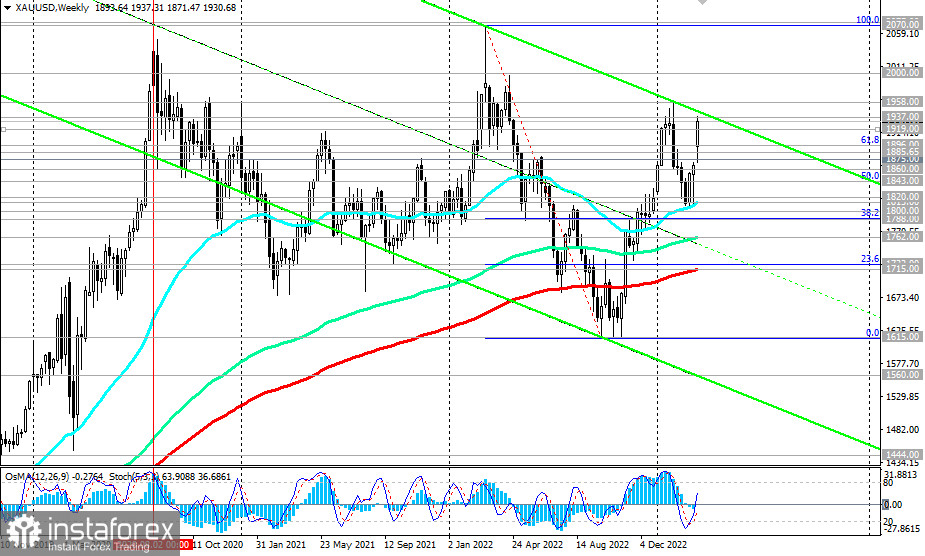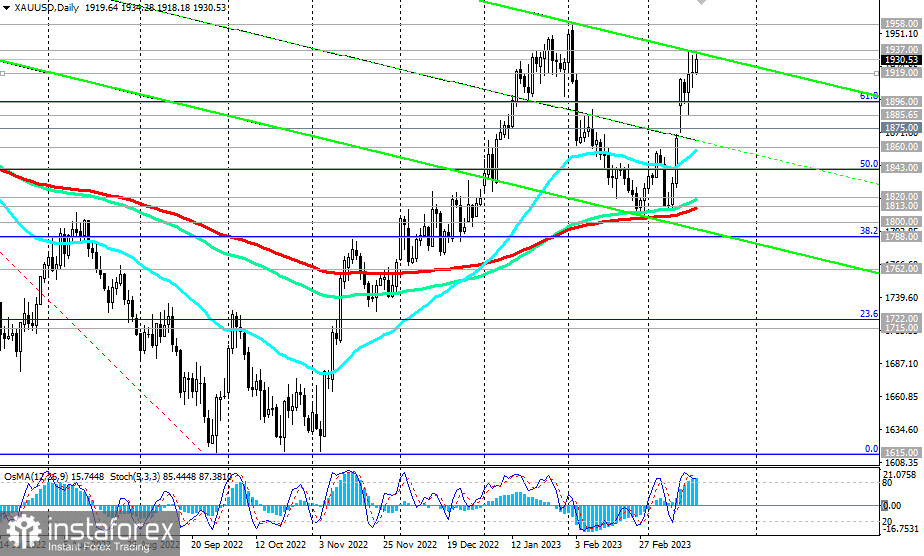
Gold hit a new six-week high of 1937.00 last Wednesday, adding nearly 3.5% for the week, and so far remains near this mark. As of writing, XAU/USD was near 1930.00 and remains in a bull market zone for short, medium, and long term. If the Fed's decision at the March 21 and 22 meetings is considered too soft by investors, we could see a new rally in gold and the XAU/USD moving towards last year's highs and above 2070.00.

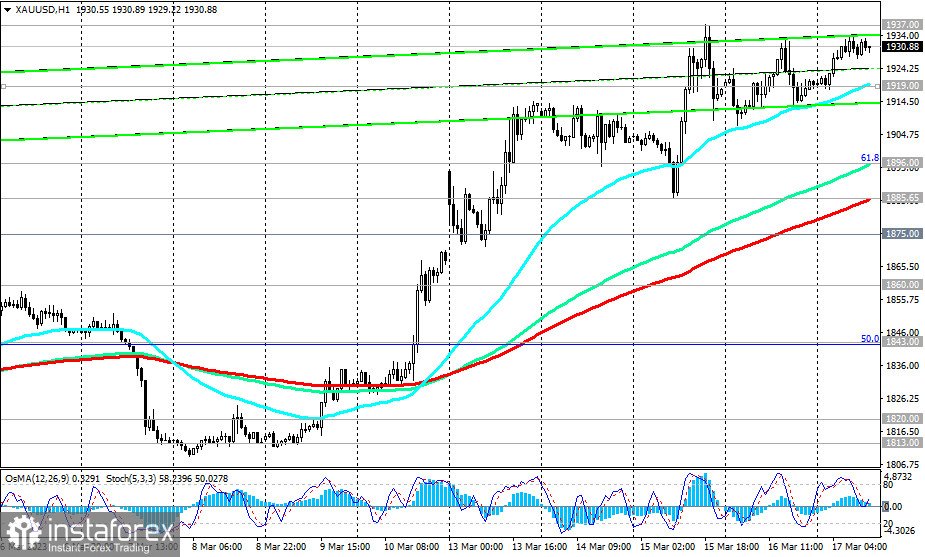
A rise above this week's high of 1,937.00 may be the first signal for long positions, even though the pair seems oversold (Stochastic, for instance, has been oversold for several days, which indicates a strong bullish momentum.)
Alternatively, XAU/USD will resume its decline. The first signal to open short positions will be the breakdown of today's low of 1919.00 and the short-term support level (200 EMA on the 15-minute chart), and the breakdown of the support levels 1885.00 (200 EMA on the 1-hour chart), 1860.00 (200 EMA on the 4-hour chart and 50 EMA on the daily chart) will be the confirming signal, with targets at key support levels 1820.00 (144 EMA on the daily chart), 1813.00 (200 EMA on the daily chart), 1800.00.

The breakdown of the support levels 1722.00 (23.6% Fibonacci level), 1715.00 (200 EMA on the weekly chart) will jeopardize the entire long-term bullish trend of gold, sending XAU/USD inside the downward channel on the weekly chart of the pair (its lower border is near the 1500.00 mark).
Support levels: 1919.00 1900.00 1896.00 1885.00 1875.00 1860.00 1843.00 1820.00 1813.00 1800.00 1788.00 1762.00 1722.00 1715.0
Resistance levels: 1937.00, 1958.00, 2000.00
Trading scenarios
Sell Stop 1918.00. Stop-Loss 1941.00. Take-Profit 1900.00, 1896.00, 1885.00, 1875.00, 1860.00, 1843.00, 1820.00, 1813.00, 1800.00, 1788.00, 1762.00, 1722.00, 1715.00
Buy Stop 1941.00. Stop-Loss 1918.00. Take-Profit 1955.00, 2000.00
 English
 Русский
 Bahasa Indonesia
 Bahasa Malay
 ไทย
ไทย Español
 Deutsch
 Български
 Français
 Tiếng Việt
 中文
中文 বাংলা
বাংলা हिन्दी
 Čeština
 Українська
 Română

