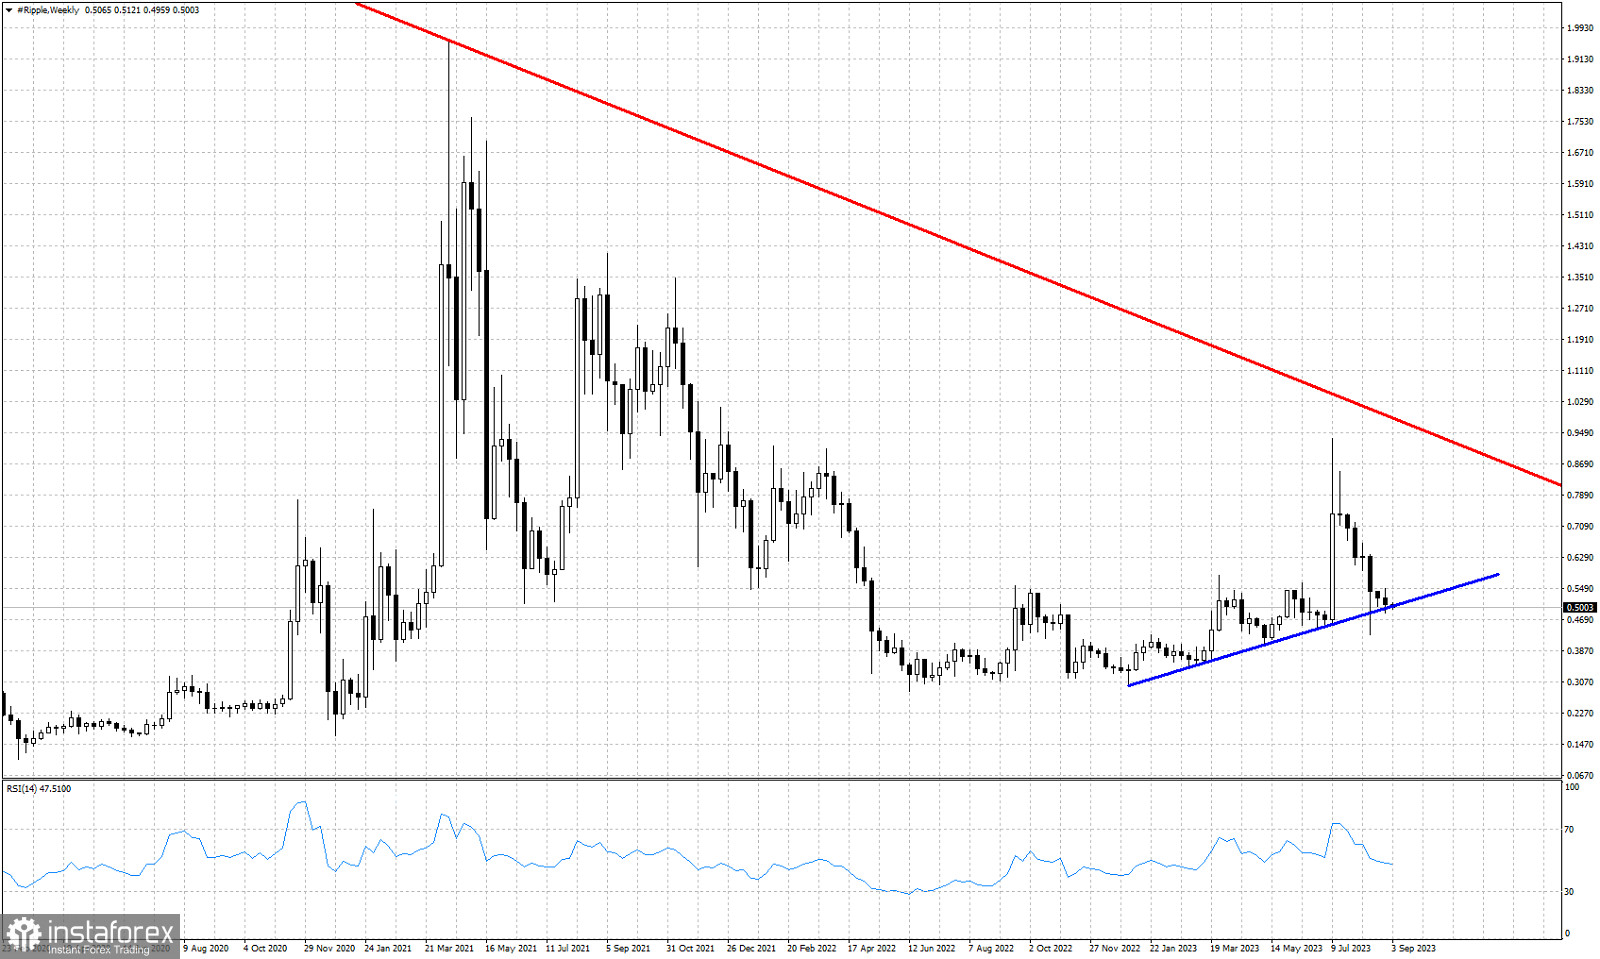
Red line- resistance
Blue line- support
XRPUSD is trading around $0.50. Price is trading just above the $0.50 price level for the last two weeks. This is where we find an important support trend line coming from November 22 lows. Price remains below the red major downward sloping resistance trend line with a new lower high formed this past summer after the initial enthusiasm that followed the judge's ruling on the case of SEC Vs Ripple. Technically bulls do not want to see price break below the blue trend line. A break below this support will put more pressure to XRPUSD and might push price lower towards $0.40 or even $0.30. Bulls need to respect the blue support trend line and push price towards the major red trend line and break it. Only then we can say that a new upward wave has started.
 English
 Русский
 Bahasa Indonesia
 Bahasa Malay
 ไทย
ไทย Español
 Deutsch
 Български
 Français
 Tiếng Việt
 中文
中文 বাংলা
বাংলা हिन्दी
 Čeština
 Українська
 Română

