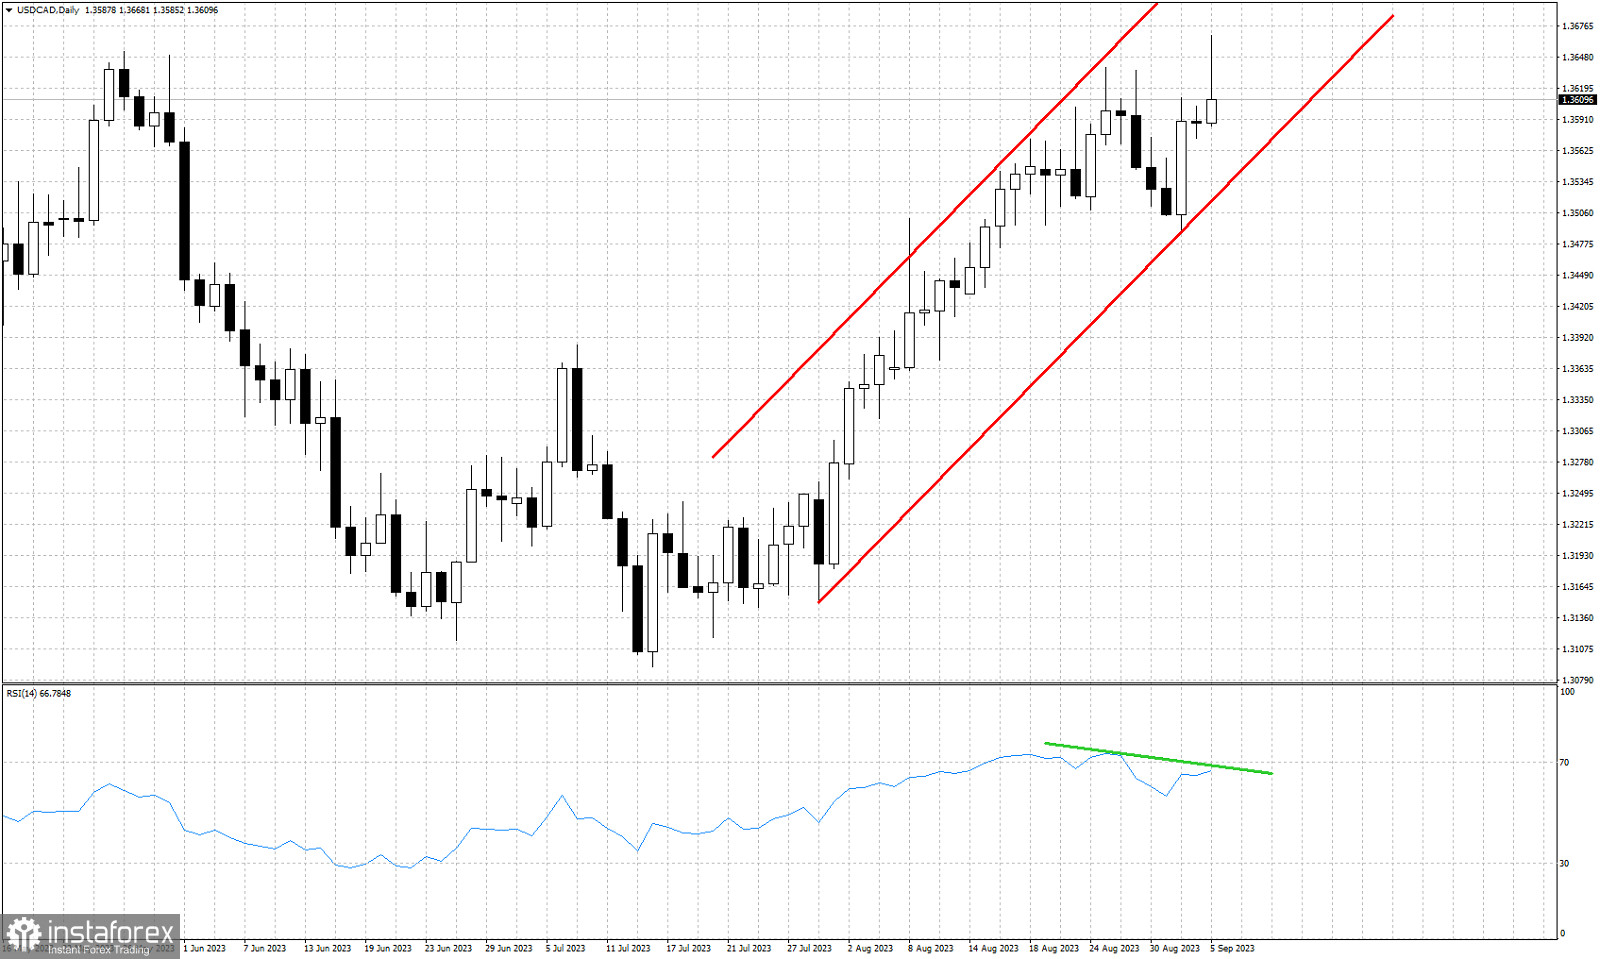
Red lines- bullish channel
Green line- bearish RSI divergence
USDCAD made a new higher high today at 1.3668. Short-term trend remains bullish as price continues making higher highs and higher lows. USDCAD remains inside the red upward sloping channel. Technically bulls remain in control of the trend. However we have two warning signals that bulls should not ignore. First is the bearish RSI divergence. The new higher high in price today was not followed by a higher high in the RSI. Secondly the daily candlestick pattern so far for today is looking like a bearish hammer reversal pattern. The long upper tail if followed by a negative candlestick with a lower low than today, will increase the chances of a top.
 English
 Русский
 Bahasa Indonesia
 Bahasa Malay
 ไทย
ไทย Español
 Deutsch
 Български
 Français
 Tiếng Việt
 中文
中文 বাংলা
বাংলা हिन्दी
 Čeština
 Українська
 Română

