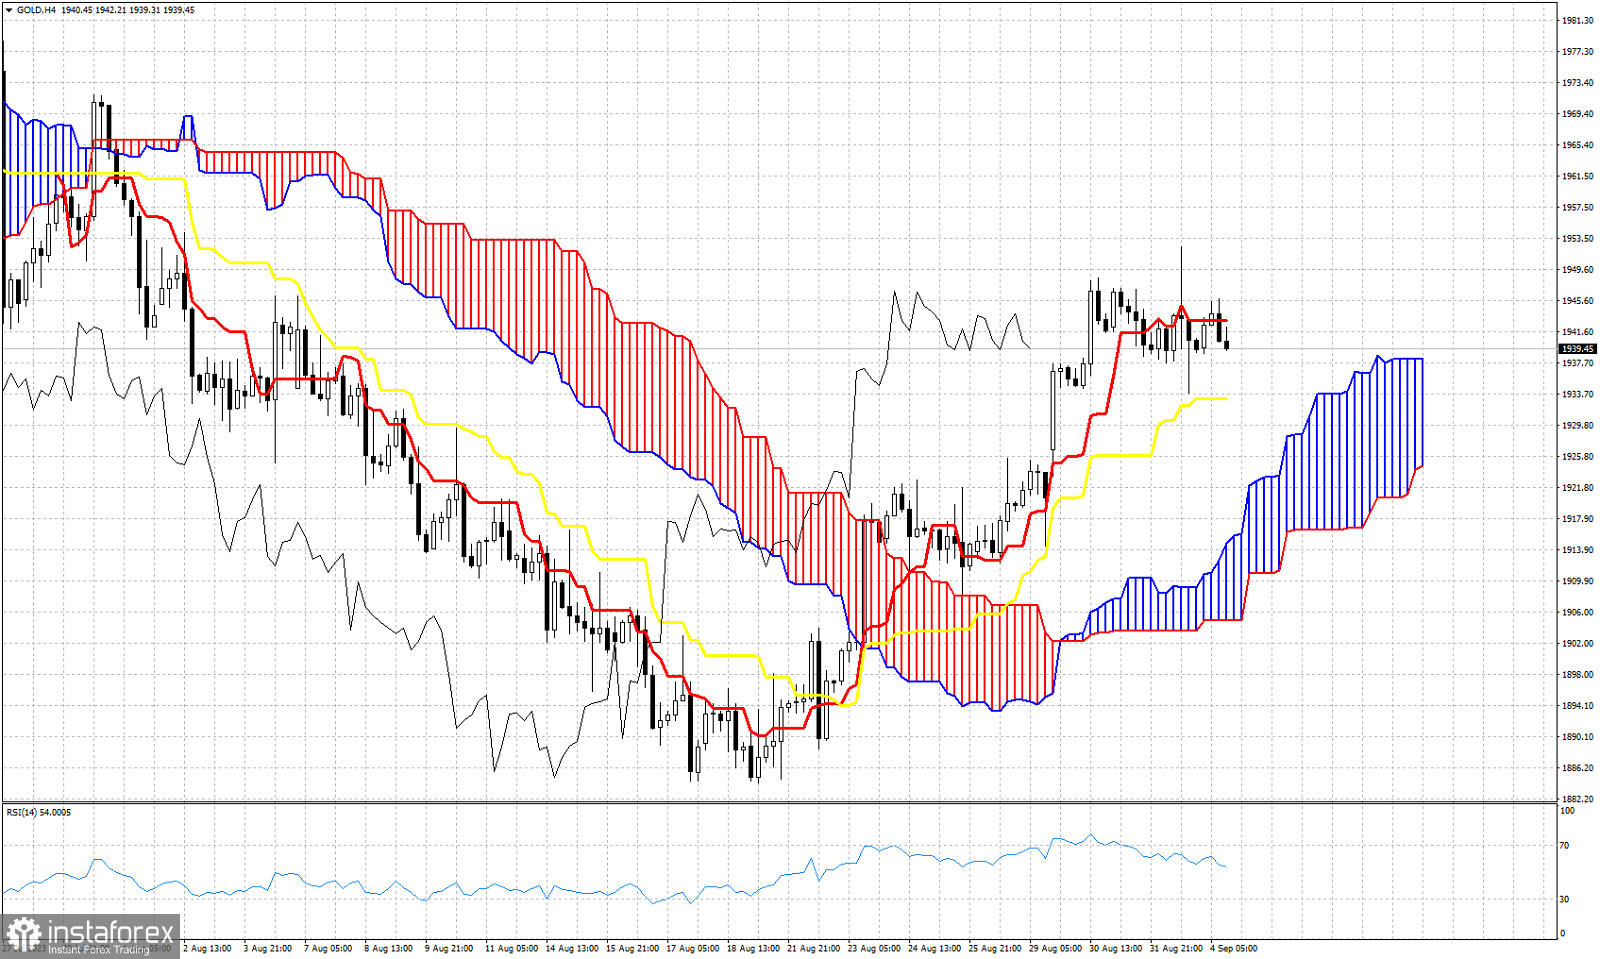
Gold price is trading around $1,939. In Ichimoku cloud terms in the 4 hour chart trend is bullish as price is above the Kumo and is making higher highs and higher lows. In the Daily chart price is challenging the Daily Kumo from below. In the 4 hour chart price is breaking below the tenkan-sen (red line indicator) support at $1,943. Next support is at $1,933 (kijun-sen). This was the first sign of weakness for the near term. If price breaks below the kijun-sen then we get a new stronger sign of weakness and we expect price to challenge the 4 hour Kumo support at $1,920-25. It is important for bulls to defend the cloud support. Even if price pulls back, bulls want to see price form a higher low around $1,920. Bulls do not want to see price break below the cloud. The Chikou span (black line indicator) is above the candlestick pattern (bullish). For now there is no solid sign of a reversal even in the 4 hour chart. However at current levels resistance is very important and a pull back is justifed and expected.
 English
 Русский
 Bahasa Indonesia
 Bahasa Malay
 ไทย
ไทย Español
 Deutsch
 Български
 Français
 Tiếng Việt
 中文
中文 বাংলা
বাংলা हिन्दी
 Čeština
 Українська
 Română

