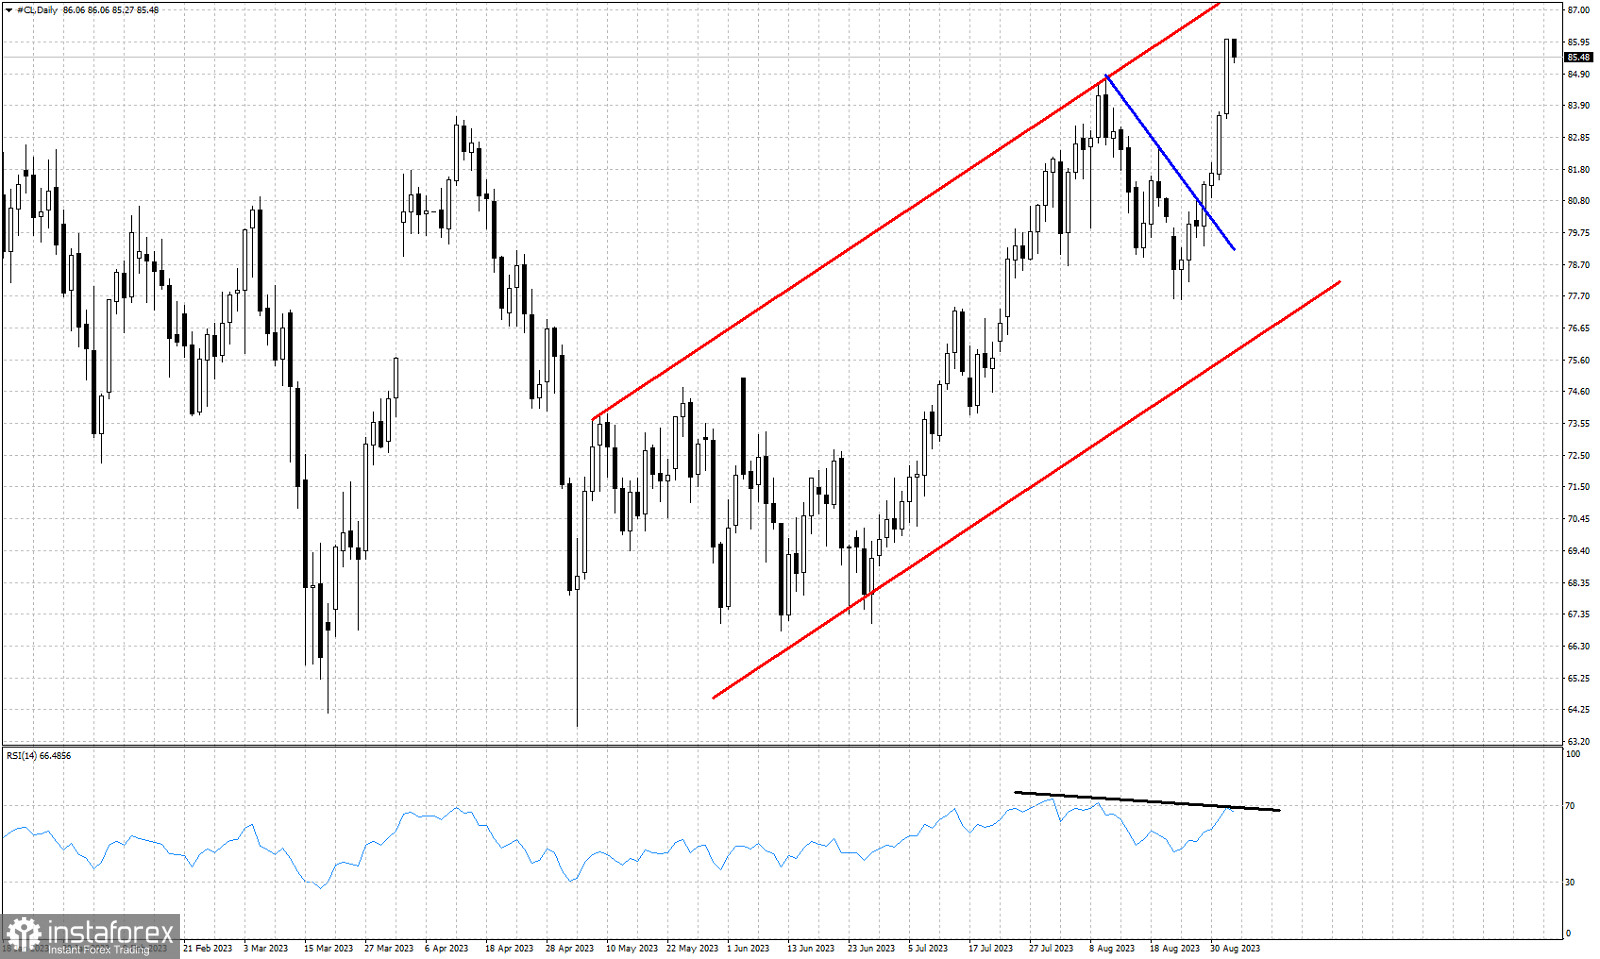
Red lines- bullish channel
Blue line- resistance trend line (broken)
Black line- bearish RSI divergence
Oil price is trading around $85.50 after making a high last week at $86.05. Short-term trend remains bullish as price is making higher highs and higher lows. In previous posts we noted that we are bearish Oil as long as price is trading below the blue downward sloping resistance trend line. This trend line was broken last Tuesday at $80.60. Since then Oil price made a new higher high but the RSI did not follow. The RSI formed another bearish divergence signal. This suggests that this upward move is weakening. This is not a reversal signal but a warning that at least a pull back is close. The new higher high in price made us re-think the medium-term bullish channel we are in. A pull back towards the lower channel boundary at $80-$78 is justified from current levels.
 English
 Русский
 Bahasa Indonesia
 Bahasa Malay
 ไทย
ไทย Español
 Deutsch
 Български
 Français
 Tiếng Việt
 中文
中文 বাংলা
বাংলা हिन्दी
 Čeština
 Українська
 Română

