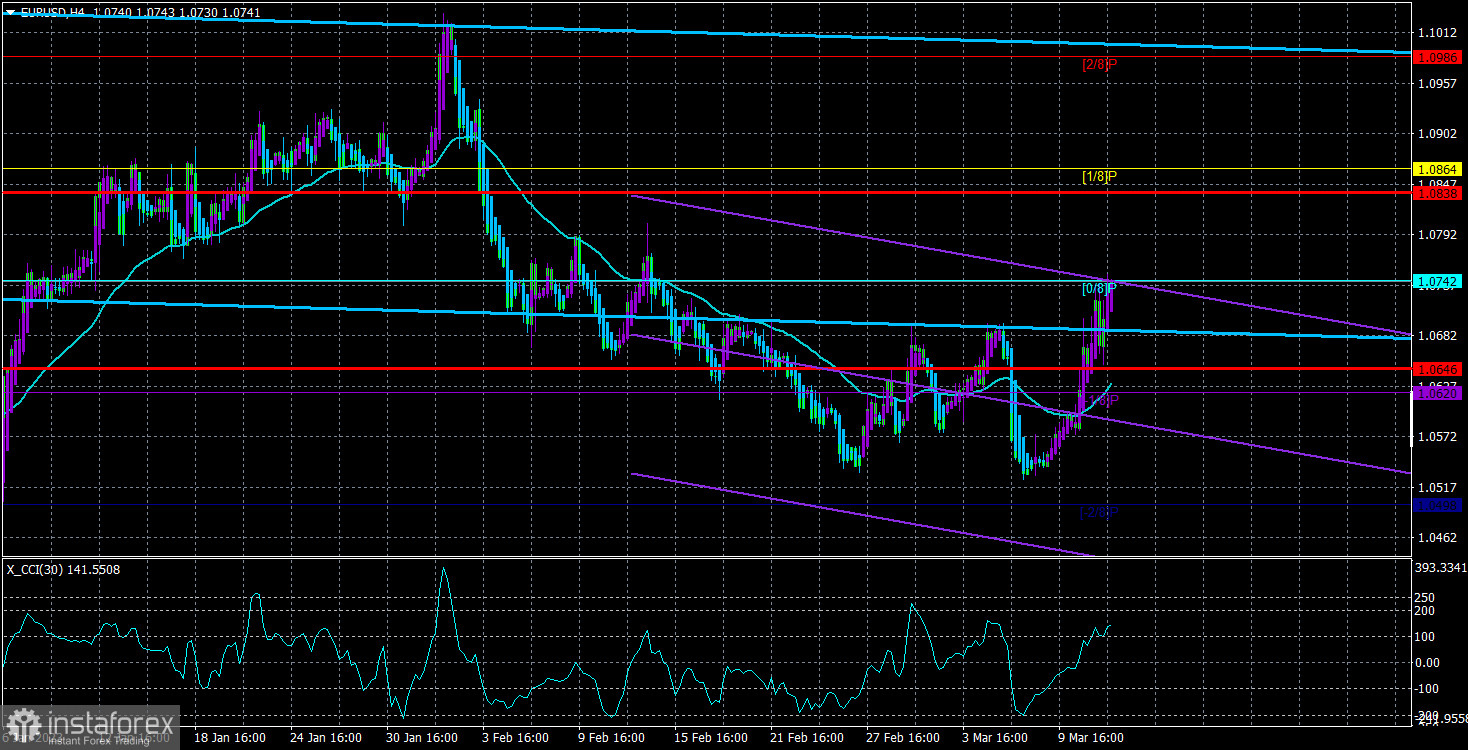
The EUR/USD currency pair increased by about 150 points between Friday and Monday. The question of why such a movement even occurred instantly emerges. It took place just as everyone was getting ready for another surge in the value of the US dollar. It is both straightforward and intricate at the same time. That all started in the middle of last week, following Jerome Powell's statements before Congress. Even if his statements surprised many people, we stated at the time that the Fed chairman did not mention anything alarming or depressing. He only raised issues that had been raised for at least a few weeks. This holds for a slower rate of key rate increases as well as a longer cycle of rate increases (inflation cannot fall to 2% at a rate below 5%). However, the market first interpreted these words as a signal to buy the dollar, but on Wednesday it unexpectedly reversed its position and began to gradually sell the American currency.
Until Friday, a gradual upward pullback remained, with a new fall possible at any time. Yet, conflicting statistics that might be construed in many ways were made public in the United States on Friday. Two significant reports on the status of the US economy, each of which directly affects the Fed's decisions, provide us with some background information. One report is positive, the other is unfavorable. It would appear that the pair should either remain stationary or simply "travel" in each direction in turn. But the market simply ignored the next strong nonfarm payroll data, but it was pleased to be working out the unemployment report, which grew by 0.2%, which has no "terrible value". Any chart of changes in this indicator will show that unemployment has been continuously rising and declining over the past year, as we previously stated. Yet, it is still close to its 50-year low, which is very significant. Hence, even a 0.2% increase has no negative effects on the economy. That would be a different situation if the indicator had been increasing for at least two to three months in a row. But nothing comparable exists. Now it appears that Friday's statistics were viewed in a biased and unbalanced manner.
What comes next?
Regrettably, rather than statistics or Powell's remarks, the market is what determines market behavior. The dollar is now falling because the market is skeptical of even a 0.25% rate hike in March. Even Friday's statistics, which no one would dare label as "failed," are not to blame; rather, it is a variety of experts and major banks with agencies who started speculating about a new financial catastrophe and the Fed's refusal to tighten further right away. As a result, the dollar is currently declining because the market misjudges the importance of the events that occurred over the weekend and on Friday. There is currently no reason for fear, as was already mentioned. Nonfarms continue to be powerful since any value greater than 200,000 can be regarded as strong. Because any value below 4% is low, unemployment continues to be low. The Fed will continue to increase rates until inflation prevails. What's different now? It has no value. Even if the dollar had dropped merely on Friday, the market's irrational response could be indirectly responsible. This occasionally occurs when a significant event is followed by the market's opposite response. On the other hand, Monday saw more growth.
As a result, the pair has already reached the key line on the 24-hour TF, and future movements are now completely unpredictable. The pair may experience a strong decline that will also surprise many, followed by a "swing," a flat, and new, groundless growth. At this point, there may be no correlation between the underlying backdrop and the pair's movements. Of course, any event or reaction can be "explained" after it has occurred. The market reacted rationally, signaling that everything is going as it should. The market reacted illogically, but you can always blame it on "expectations," "fears," "risk appetite" or a lack thereof, or any other make-believe explanation. Hence, the first thing to remember is that in the near future, while opening medium-term positions, the pair's rate may "fly" from side to side. Second, we must await the outcomes of the meetings between the ECB and the Fed. Even though the ECB meeting is already the next week, we shouldn't anticipate any shocks. Although this decision to raise the rate by 0.5% has been in the works for a while, the market has been aware of it plainly for the past two months. This has caused the euro currency to stop rising at the moment.

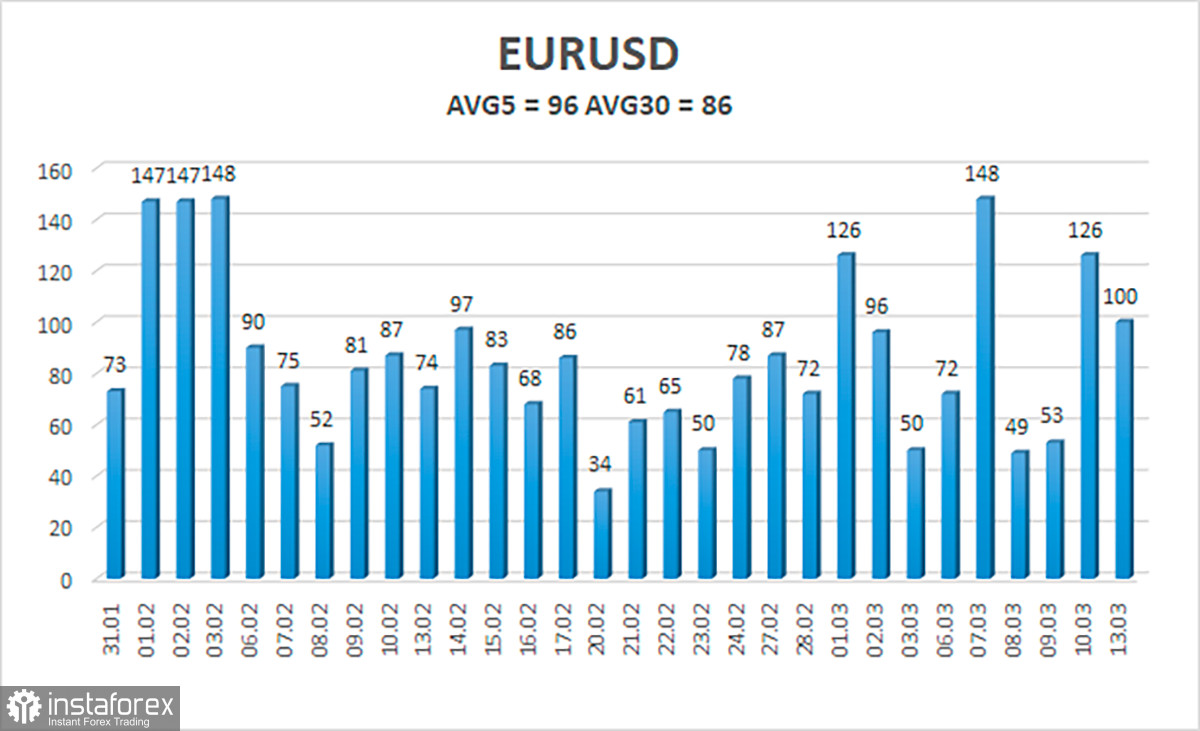
As of March 14, the euro/dollar currency pair's average volatility over the previous five trading days was 96 points, which is considered to be "high." Hence, on Tuesday, we anticipate the pair to move between 1.0646 and 1.0838. The Heiken Ashi indicator's downward turn will signal a potential continuation of the downward movement.
Nearest levels of support
S1 – 1.0620
S2 – 1.0498
S3 – 1.0376
Nearest levels of resistance
R1 – 1.0742
R2 – 1.0864
R3 – 1.0986
Trade Suggestions:
The EUR/USD pair has resumed consolidation above the moving average line. Until the Heiken Ashi indicator turns down, you can continue holding long positions with targets of 1.0838 and 1.0864. After the price is fixed below the moving average line, short positions can be opened with a target of 1.0498.
Explanations for the illustrations:
Channels for linear regression - allow us to identify the present trend. The trend is now strong if they are both moving in the same direction.
Moving average line (settings 20.0, smoothed): This indicator identifies the current short-term trend and the trading direction.
Murray levels serve as the starting point for adjustments and movements.
Volatility levels (red lines) are the likely price channel in which the pair will spend the next day, based on current volatility indicators.
A trend reversal in the opposite direction is imminent when the CCI indicator crosses into the overbought (above +250) or oversold (below -250) zones.
 English
 Русский
 Bahasa Indonesia
 Bahasa Malay
 ไทย
ไทย Español
 Deutsch
 Български
 Français
 Tiếng Việt
 中文
中文 বাংলা
বাংলা हिन्दी
 Čeština
 Українська
 Română

