Technical Market Outlook:
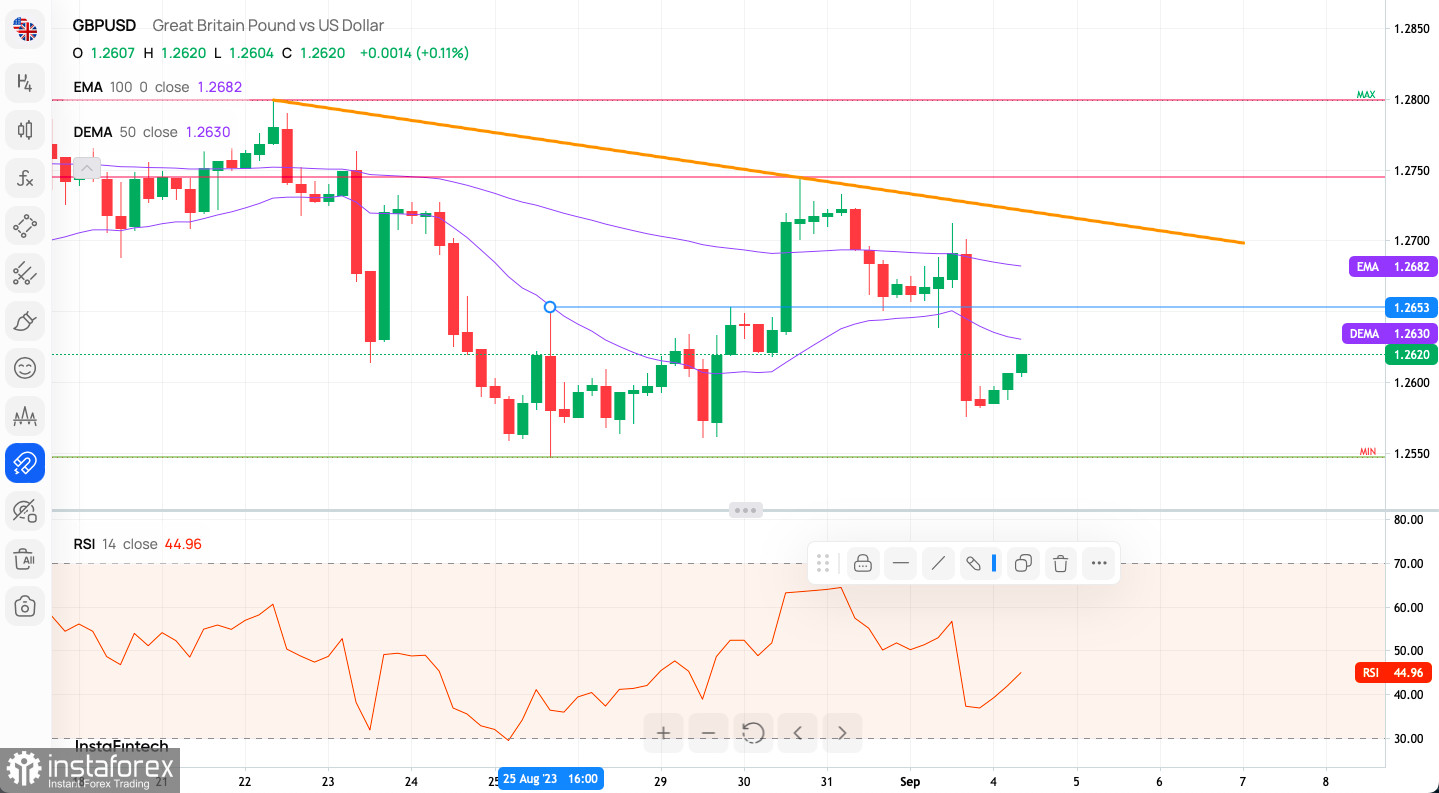
The GBP/USD pair has been moving lower on the H4 time frame chart. Recently the price reversed towards the last technical support located at the level of 1.2547. The market still trades below the short-term trend line resistance, so any violation of the level of 1.2547 will extend the drop lower towards the level of 1.2491 and 1.2426. The intraday technical resistance is seen at the level of 1.2653 and the intraday technical support is seen at the level of 1.2576. The weak and negative momentum on the H4 time frame chart support the short-term bearish outlook for GBP.

Weekly Pivot Points:
WR3 - 1.26635
WR2 - 1.26342
WR1 - 1.26237
Weekly Pivot - 1.26049
WS1 - 1.25944
WS2 - 1.25756
WS3 - 1.25463
Trading Outlook:
The bulls keep continuing the up trend towards the key technical resistance located at the level of 1.3163 and a breakout above this level is needed to extend the up trend towards the last Weekly swing high seen at 1.4248. Only a sustained breakout blow the technical support seen at the level of 1.1775 would change the outlook to bearish.
 English
 Русский
 Bahasa Indonesia
 Bahasa Malay
 ไทย
ไทย Español
 Deutsch
 Български
 Français
 Tiếng Việt
 中文
中文 বাংলা
বাংলা हिन्दी
 Čeština
 Українська
 Română

