Information about the collapse of Silicon Valley Bank, one of the largest banks in the U.S., sent shockwaves through the global financial market. Futures and other risky financial instruments collapsed last week and continued to decline today, opening the trading day with a gap down. The dollar also fell sharply.
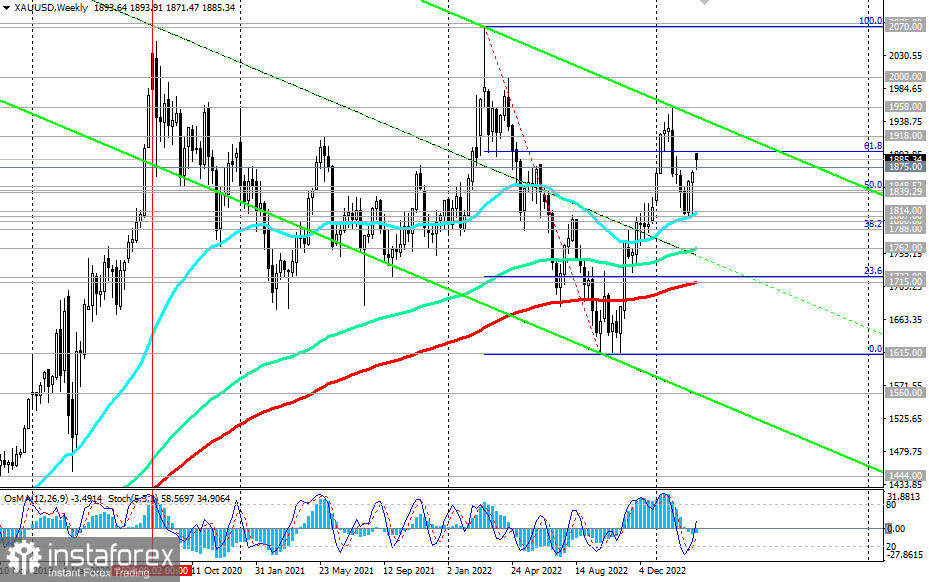
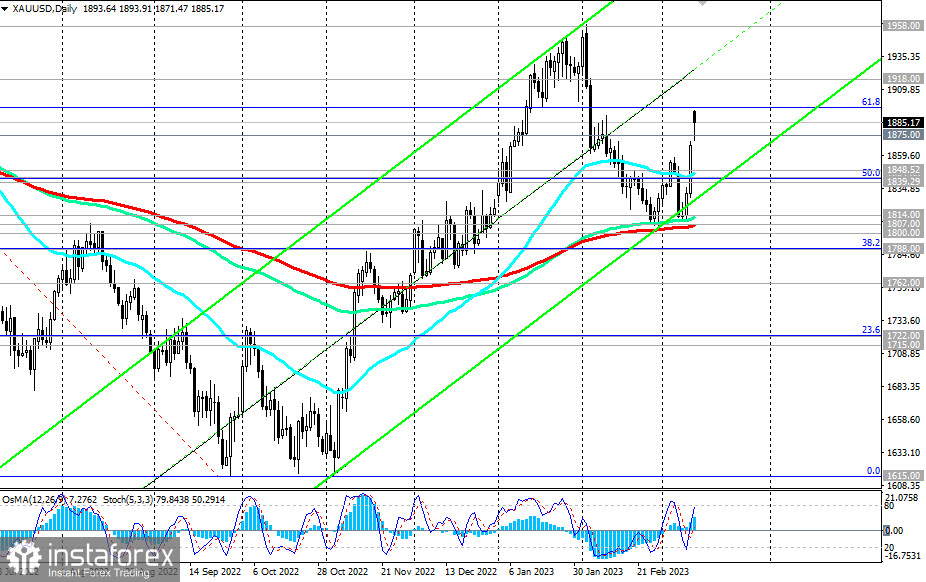
In the current situation, the demand for traditional defensive assets such as government bonds, the franc, the yen, and gold rose sharply. Gold soared to 1893.00 today, corresponding to the highs of February 6. Last week, XAU/USD fell towards the key support levels 1814.00 (144 EMA on the daily chart) and 1807.00 (200 EMA on the daily chart), separating the medium-term bull market from the bear market.

However, at the end of last week the situation changed sharply to the opposite and today it continued.
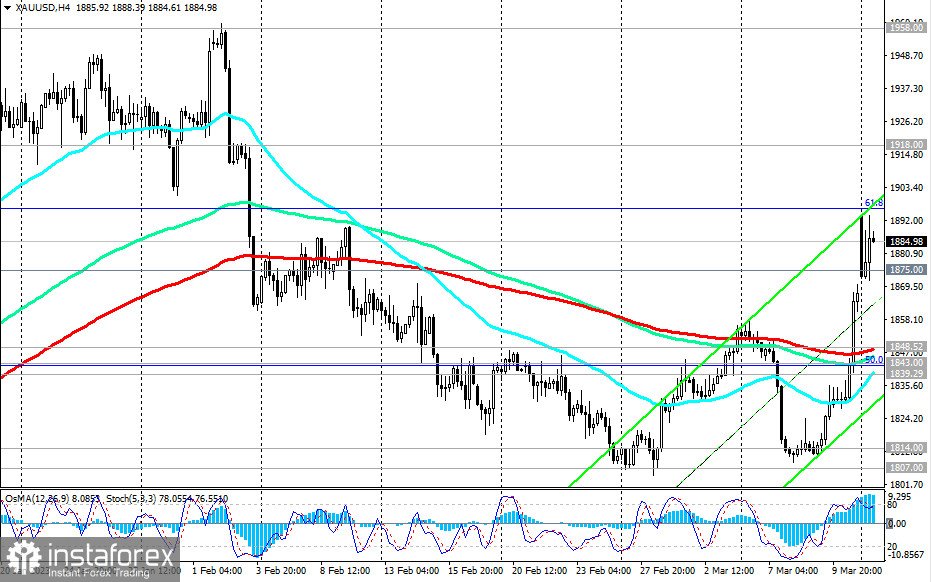
In case of further growth of XAU/USD, the nearest targets are 1896.00 (61.8% Fibonacci in the previous wave of decline from 2070.00 to 1615.00, reached in September last year), 1900.00.
In general, a long-term bullish trend remains above the key support levels 1715.00 (200 EMA on the weekly chart) and 1807.00 (200 EMA on the daily chart), which makes long positions preferable.

In an alternative scenario, XAU/USD will resume its decline. The first signal to open short positions will be the breakdown of the local support levels 1875.00, 1871.00 (today's low), and the breakdown of the support levels 1848.00 (200 EMA on the 4-hour chart), 1843.00 (50% Fibonacci level), 1840.00 (200 EMA on the 1-hour chart) – confirming, with targets at support levels 1814.00, 1807.00, 1800.00.
The breakdown of the support levels 1722.00 (23.6% Fibonacci level), 1715.00 (200 EMA on the weekly chart) will jeopardize the entire long-term bullish trend of gold, sending XAU/USD inside the downward channel on the weekly chart of the pair.
This scenario could develop if the Fed strengthens its tough stance on high inflation and returns to aggressive interest rate hikes again.
Support levels: 1875.00, 1870.00, 1850.00, 1848.00, 1843.00, 1840.00, 1814.00, 1807.00, 1800.00, 1788.00, 1772.00, 1715.00
Resistance levels: 1896.00, 1900.00, 1918.00, 1960.00
Trading scenarios
Sell Stop 1869.00. Stop-Loss 1897.00. Take-Profit 1850.00, 1848.00, 1843.00, 1840.00, 1814.00, 1807.00, 1800.00, 1788.00, 1772.00, 1715.00
Buy Stop 1897.00. Stop-Loss 1869.00. Take-Profit 1900.00, 1918.00, 1960.00, 2000.00
 English
 Русский
 Bahasa Indonesia
 Bahasa Malay
 ไทย
ไทย Español
 Deutsch
 Български
 Français
 Tiếng Việt
 中文
中文 বাংলা
বাংলা हिन्दी
 Čeština
 Українська
 Română

