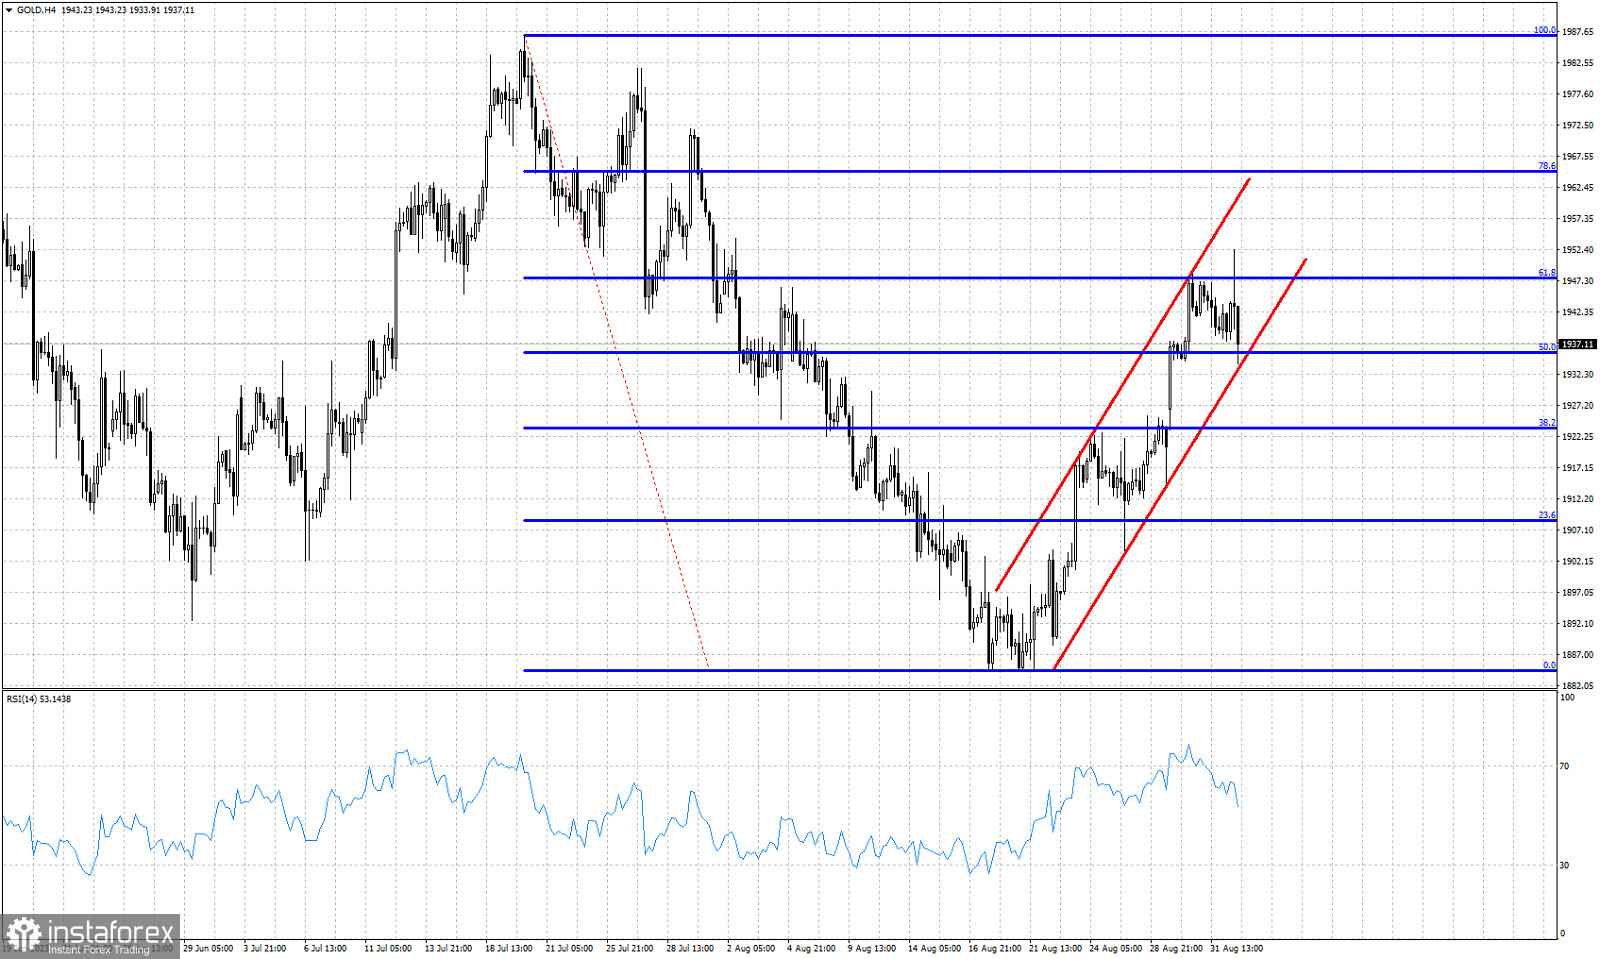
Blue lines- Fibonacci retracement levels
Red lines- bullish channel
Gold price made a new higher high today at $1,952 but bulls were not strong enough to hold the gains. In our previous posts we warned that the price zone around $1,950 is very important resistance and that current market conditions justified for Gold price to pull back towards the lower channel boundary. Technically trend remains bullish as price continues to trade inside the red channel. Today price is challenging the lower channel support around $1,933. Gold price has so far managed to bounce towards the 61.8% Fibonacci retracement but bulls were not strong enough in two attempts to stay above $1,948. Gold remains vulnerable to more downside.
 English
 Русский
 Bahasa Indonesia
 Bahasa Malay
 ไทย
ไทย Español
 Deutsch
 Български
 Français
 Tiếng Việt
 中文
中文 বাংলা
বাংলা हिन्दी
 Čeština
 Українська
 Română

