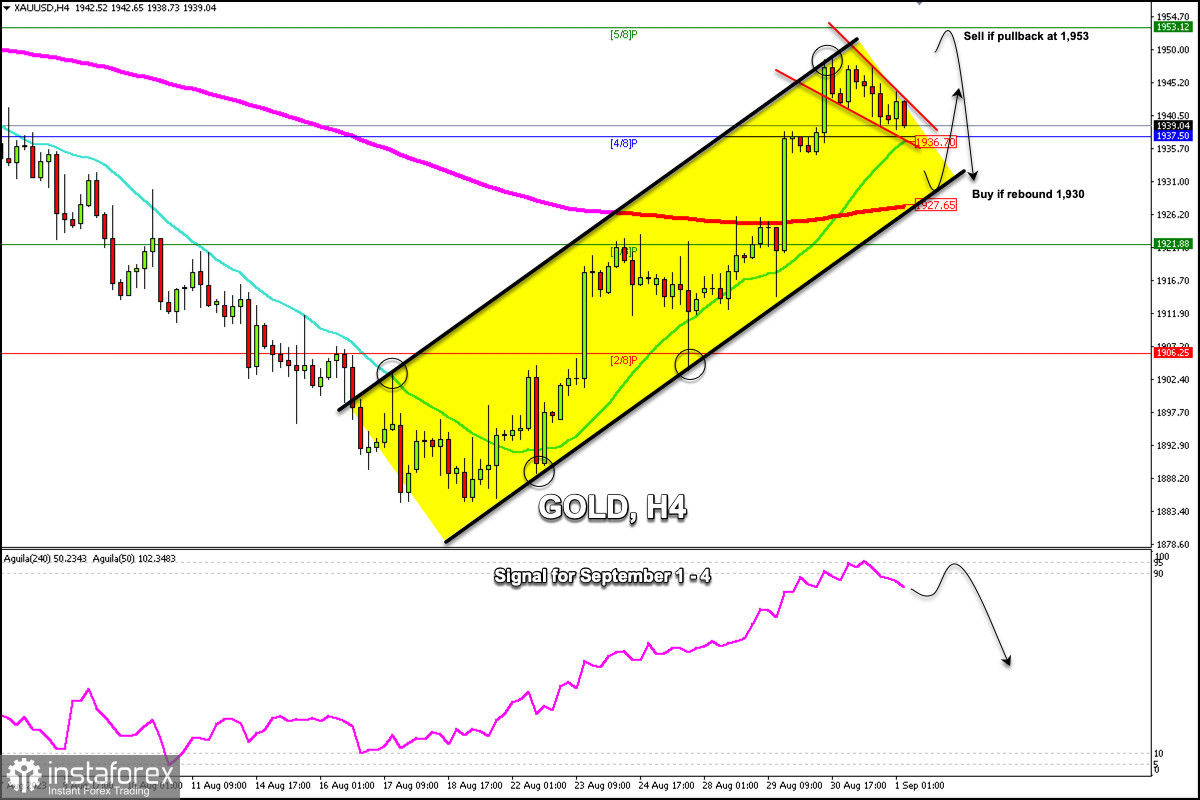
Early in the European session, gold is trading around 1,939.04 with a reversal below the 5/8 Murray (1,953), above the 4/8 Murray, and above the 21 SMA, which could act as support.
We can see a slight technical correction. However, if gold breaks above 1,941, we could expect the bullish cycle to resume and the price could reach 1,953.
In case gold falls below 1,937 in the next few hours, we could expect it to reach the bottom of the uptrend channel formed since August 17 and the price could drop to 1,930 and even to the 200 EMA located at 1,927.
In the bullish scenario, if the XAU/USD pair reaches 1,953, it could suffer from overbought conditions. This be seen as an opportunity to sell with the target at 1,930.
On the other hand, in the bearish scenario, if gold falls towards the 200 EMA, the price action around this level could be seen as an opportunity to buy with targets at 1,937, 1,945, and 1,953.
At the opening of the American session, the market will be attentive to the non-farm payroll report for August. The US economy is expected to create 170,000 jobs during that month. If the actual figure falls below this level, it could support gold and it could resume its bullish cycle. If the data is positive for the US dollar, we could expect the instrument to fall towards the 1,927 area. We could even expect a return towards the psychological level of $1,900.
On the 4-hour chart, we see that gold has reached the 61.8% Fibonacci zone, ranging from the 1,987 high to the 1,884 low. Therefore, if gold trades below 1,948, we would expect the bearish cycle to resume in the medium term and the metal could reach the psychological level of 1,900 and even decline below 1,884.
In the chart above, we can see that the eagle indicator reached 95 points. Since then, we have seen a technical correction in gold. This suggests that if there is a pullback below 1,953 in the next few hours, it could be seen as a signal to sell because the eagle indicator supports our bearish strategy.
 English
 Русский
 Bahasa Indonesia
 Bahasa Malay
 ไทย
ไทย Español
 Deutsch
 Български
 Français
 Tiếng Việt
 中文
中文 বাংলা
বাংলা हिन्दी
 Čeština
 Українська
 Română

