EUR/USD

Higher time frames
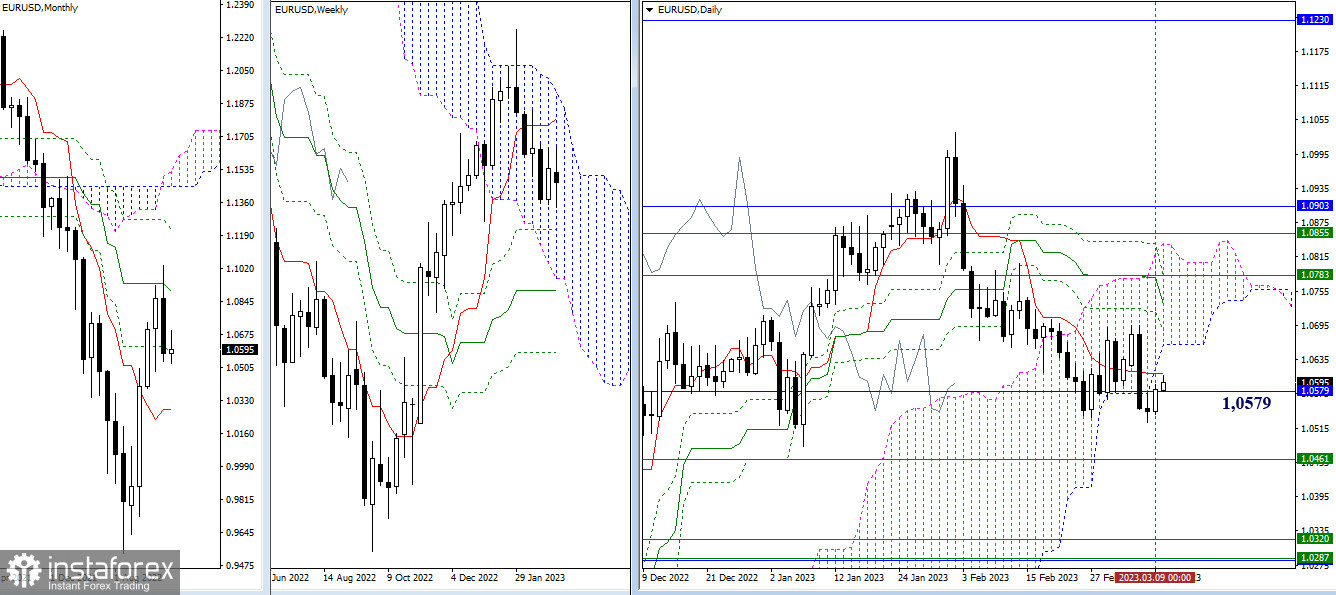
At the end of the trading week, no major changes are observed on the chart and market uncertainty still persists. The pair is trading near the monthly support level of 1.0579. The nearest resistance is seen at the daily short-term trend level of 1.0610 and the lower boundary of the daily Ichimoku Cloud at 1.0661. The main goal for bulls today will be to cancel the daily Death Cross pattern and leave the weekly consolidation zone at 1.0705. In the current conditions, the main focus of the bears will be on the support zone of 1.0461 – 1.0320 – 1.0284 on the weekly and daily time frames. Then they may head for the next downward target to break out of the Ichimoku Cloud.

H4 – H1
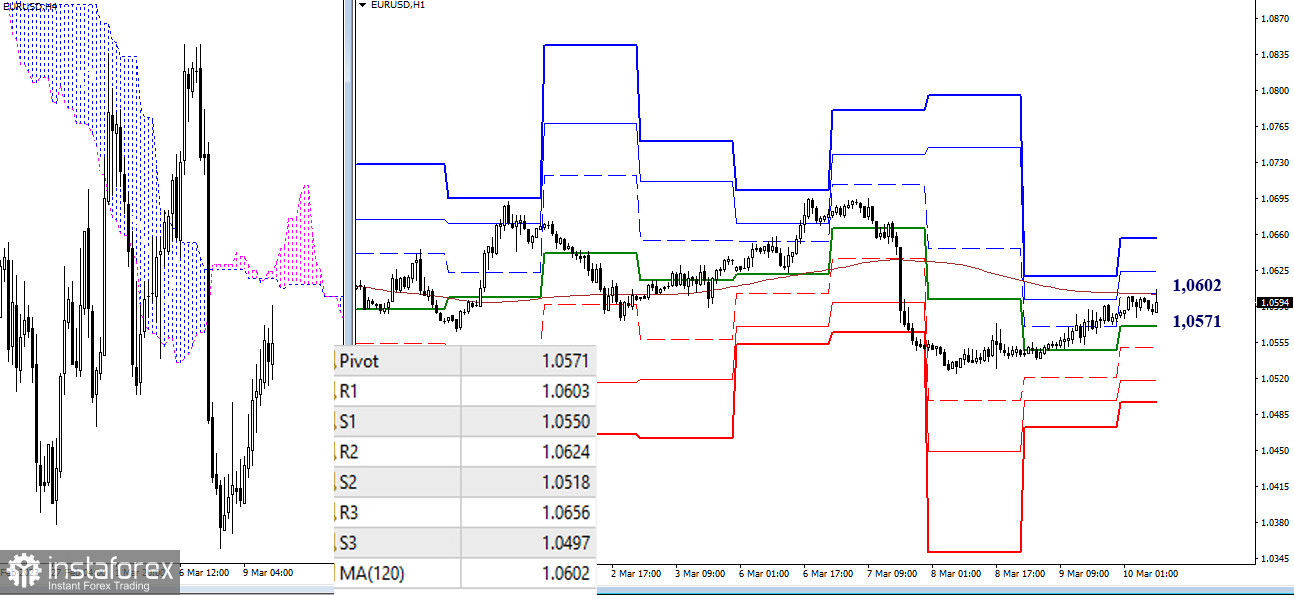
In the course of an upward correction on lower time frames, the pair tested the key level of the weekly long-term trend at 1.0602. Consolidation above this range and a reversal of the moving average will change the current market balance on lower time frames and will create the basis for a further bullish trend. Additional intraday targets are located at the resistance of pivot levels at 1.0624 – 1.0656. A rebound from the weekly long-term trend level and a retest of the low of 1.0525 will end the correction and push the pair down. Intraday support levels are located at the standard pivot levels of 1.0518 – 1.0497.
***
GBP/USD

Higher time frames
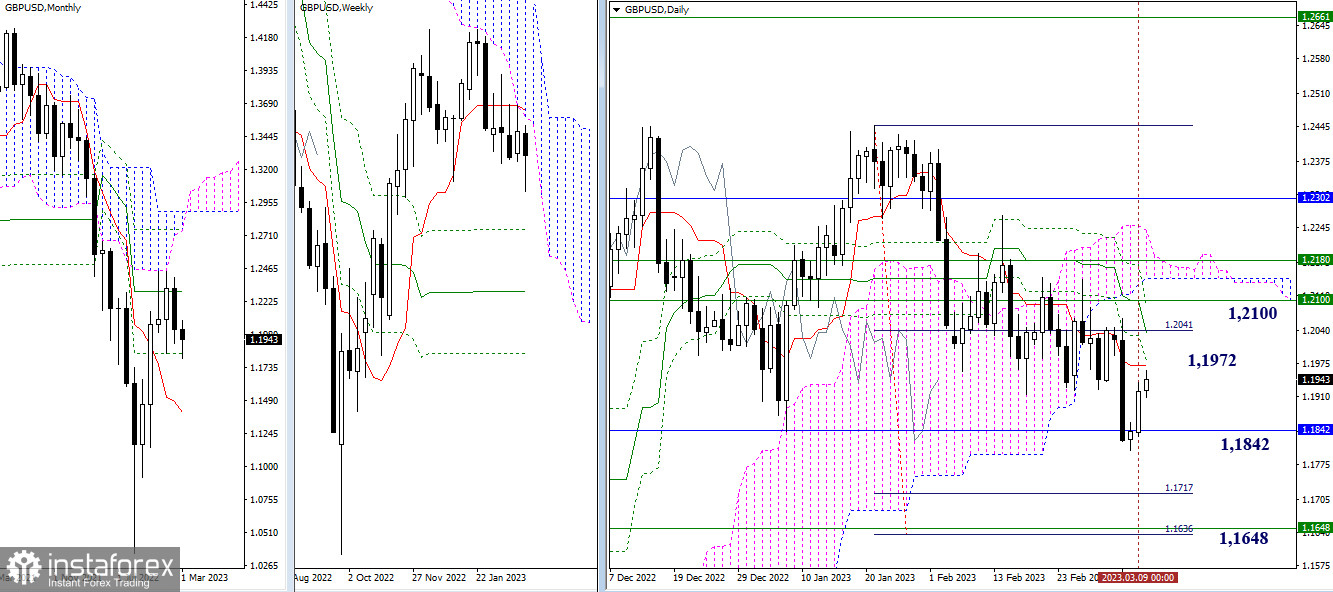
After facing strong monthly support at 1.1842, the price started an upside correction to the daily short-term trend level of 1.1972. The main task for the buyers today is to cancel the daily Death Cross pattern and test the weekly resistance at 1.2100. If bears regain control of the monthly support at 1.1842, their main goal will be to break through the Ichimoku Cloud at 1.1717 – 1.1636 which is now reinforced by the weekly Fino Kijun level of 1.1648.

H4 – H1
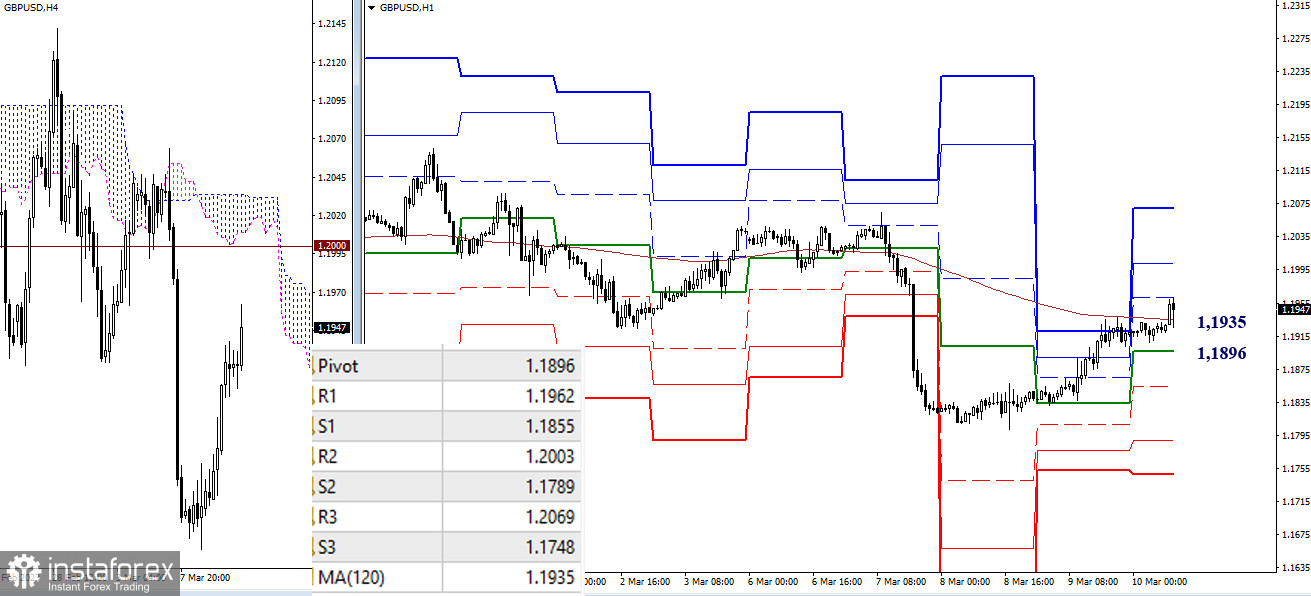
On lower time frames, the pair is trying to break above the resistance found at the weekly long-term trend level of 1.1935. More upward targets on the intraday chart are seen at the standard pivot levels of 1.1962 – 1.2003 – 1.2069. If sellers manage to take over the key levels of 1.1935 – 1.1896 (central pivot level + weekly long-term trend) and retest the low of 1.1802, their focus will shift toward the next intraday support at S2 -1.1789 and S3 -1.1748.
***
Technical analysis is based on:
Higher time frames – Ichimoku Kinko Hyo (9.26.52) + Fibo Kijun levels
Lower time frames – H1: Pivot Points (standard) + 120-day Moving Average (weekly long-term trend)
 English
 Русский
 Bahasa Indonesia
 Bahasa Malay
 ไทย
ไทย Español
 Deutsch
 Български
 Français
 Tiếng Việt
 中文
中文 বাংলা
বাংলা हिन्दी
 Čeština
 Українська
 Română

