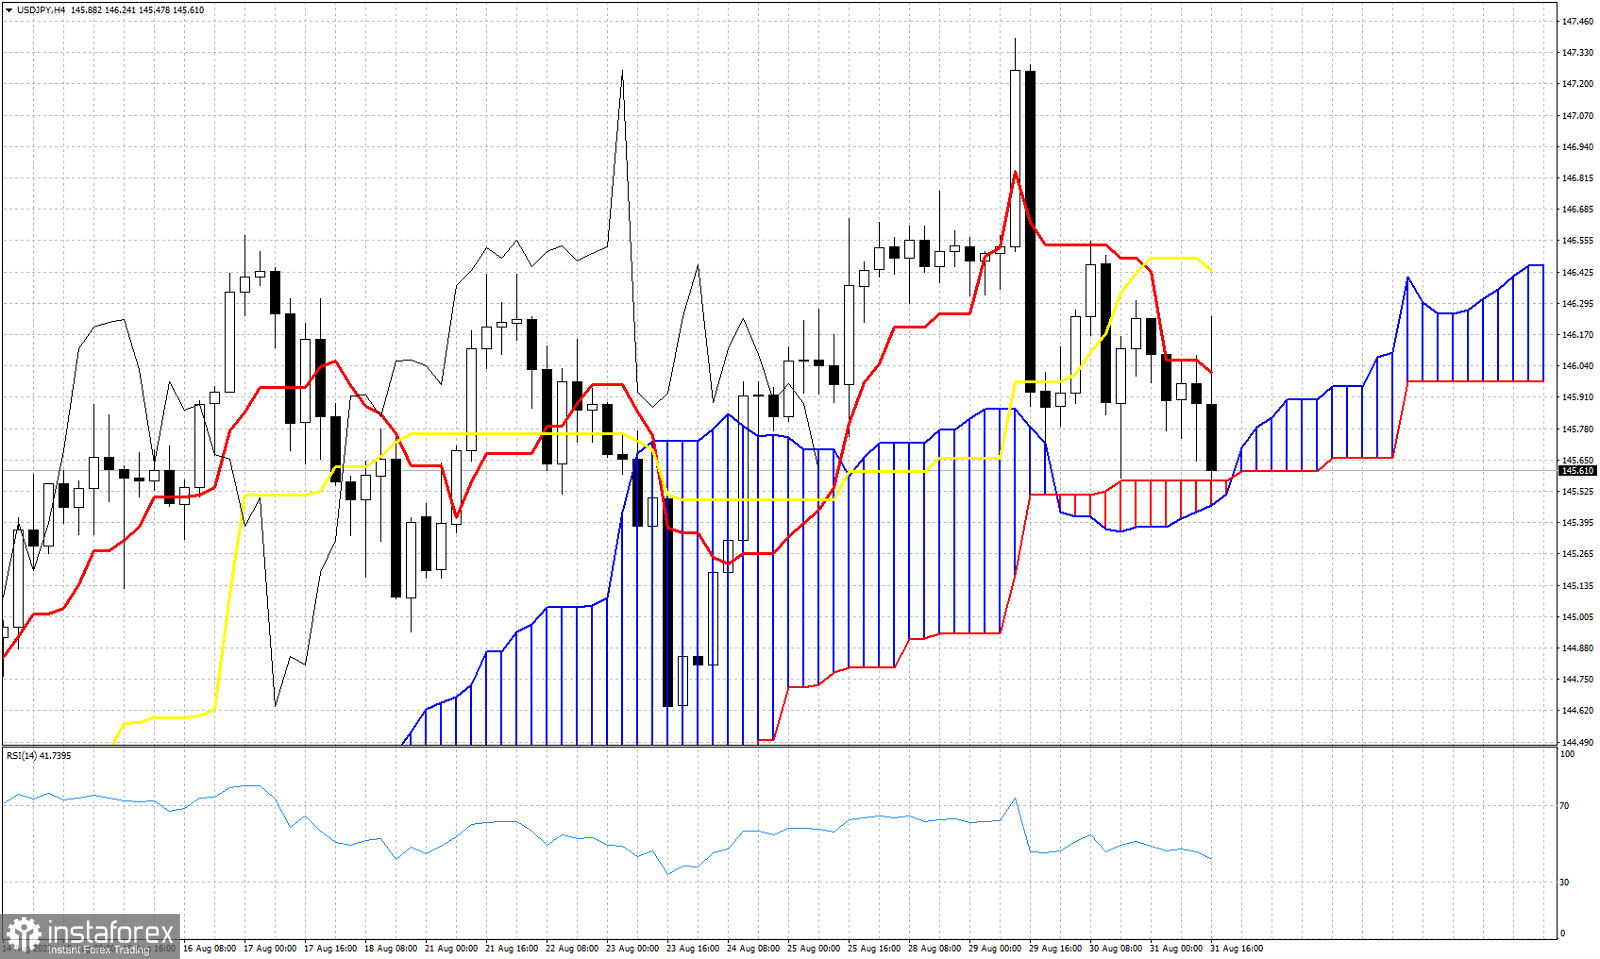
USDJPY is trading around 145.57. As we mentioned in our analysis yesterday price is vulnerable to a move lower as it has broken below the tenkan-sen (red line indicator). Price yesterday broke also below the kijun-sen (yellow line indicator) and tested the cloud in the 4 hour chart. The tenkan-sen has crossed below the kijun-sen providing another sign of weakness. Key support is at 145.35-145.45 where we find the 4 hour Kumo. A break below this level will turn short-term trend to bearish. The Chikou span (black line indicator) is currently below the candlestick pattern (bearish). Resistance is found at 146 and 146.43. USDJPY can soon provide a trend change signal if it fails to hold 145.35-145.45 level. This will lead to a bigger decline as we explained in our previous post.
 English
 Русский
 Bahasa Indonesia
 Bahasa Malay
 ไทย
ไทย Español
 Deutsch
 Български
 Français
 Tiếng Việt
 中文
中文 বাংলা
বাংলা हिन्दी
 Čeština
 Українська
 Română

