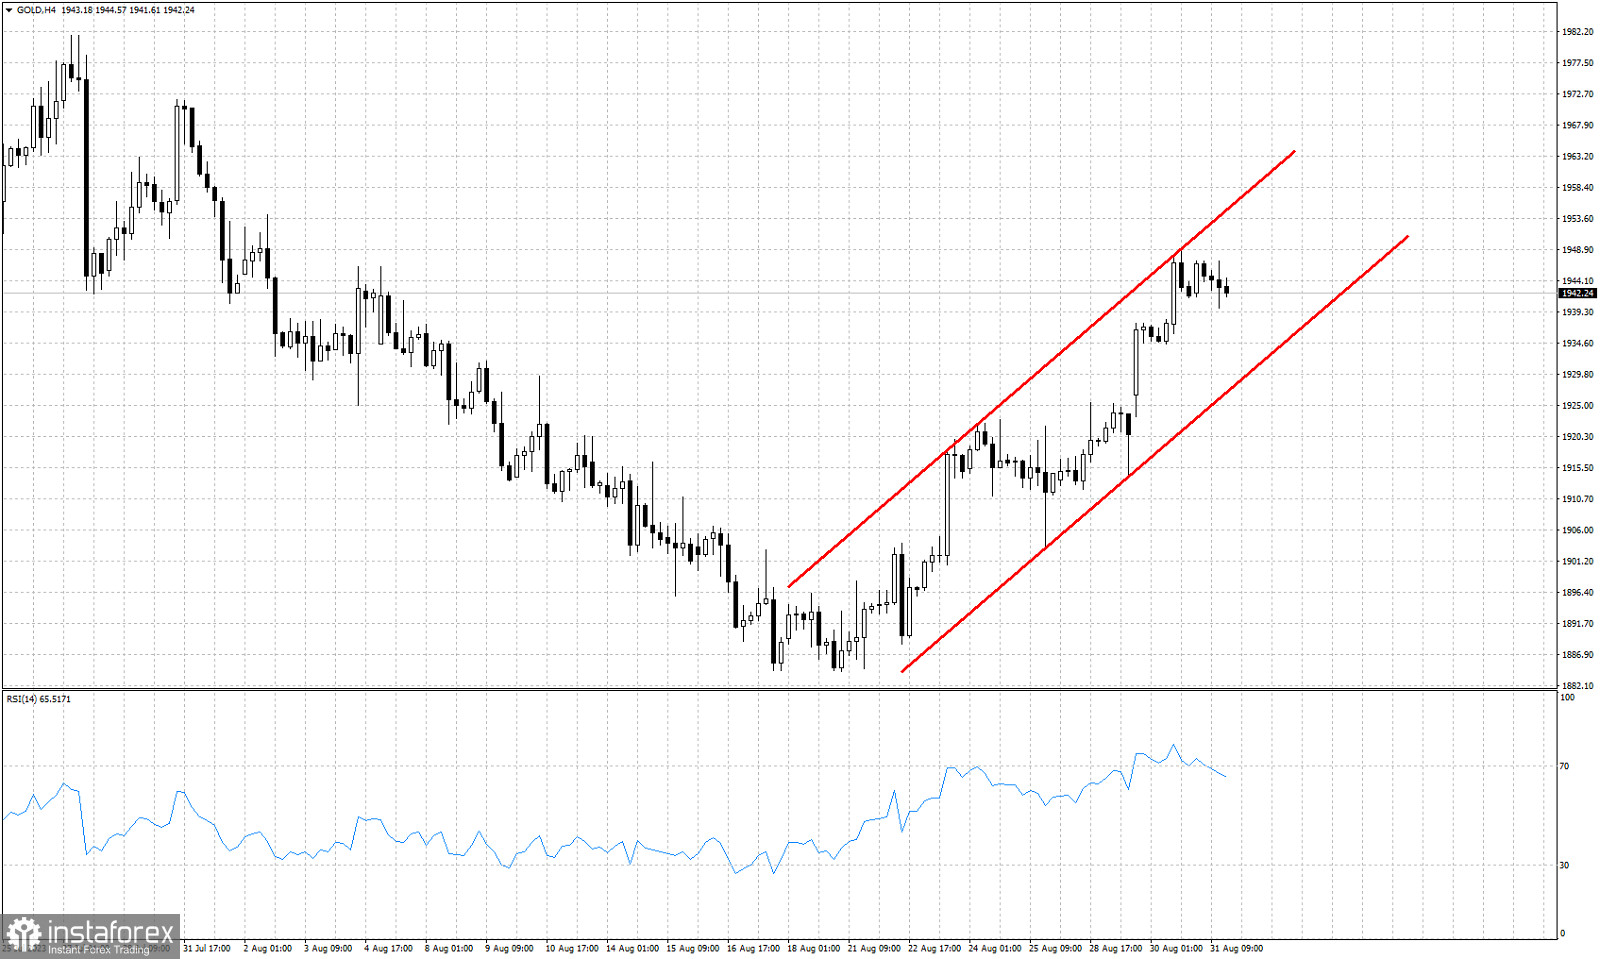
 Ichimoku cloud resistance we mentioned yesterday. With a recent high at $1,948, Gold seems to have stopped its advance where we find the 61.8% Fibonacci retracement of the entire decline from $1,983. The $1,948-52 area in a confluence of important resistance. The RSI in the 4 hour chart has reached the overbought level and is turning lower. Gold price justifies a pull back towards $1,935-30 to test the lower channel boundary. A move outside and below the channel will be a bigger sign of weakness and could lead to the start of a new downward wave. Around $1,950 I prefer to be neutral if not bearish Gold.
FX.co ★ Technical analysis on Gold for August 31st, 2023.
 Relevance until
Technical analysis on Gold for August 31st, 2023.
*The market analysis posted here is meant to increase your awareness, but not to give instructions to make a trade
 English
 Русский
 Bahasa Indonesia
 Bahasa Malay
 ไทย
ไทย Español
 Deutsch
 Български
 Français
 Tiếng Việt
 中文
中文 বাংলা
বাংলা हिन्दी
 Čeština
 Українська
 Română
