Transaction analysis:
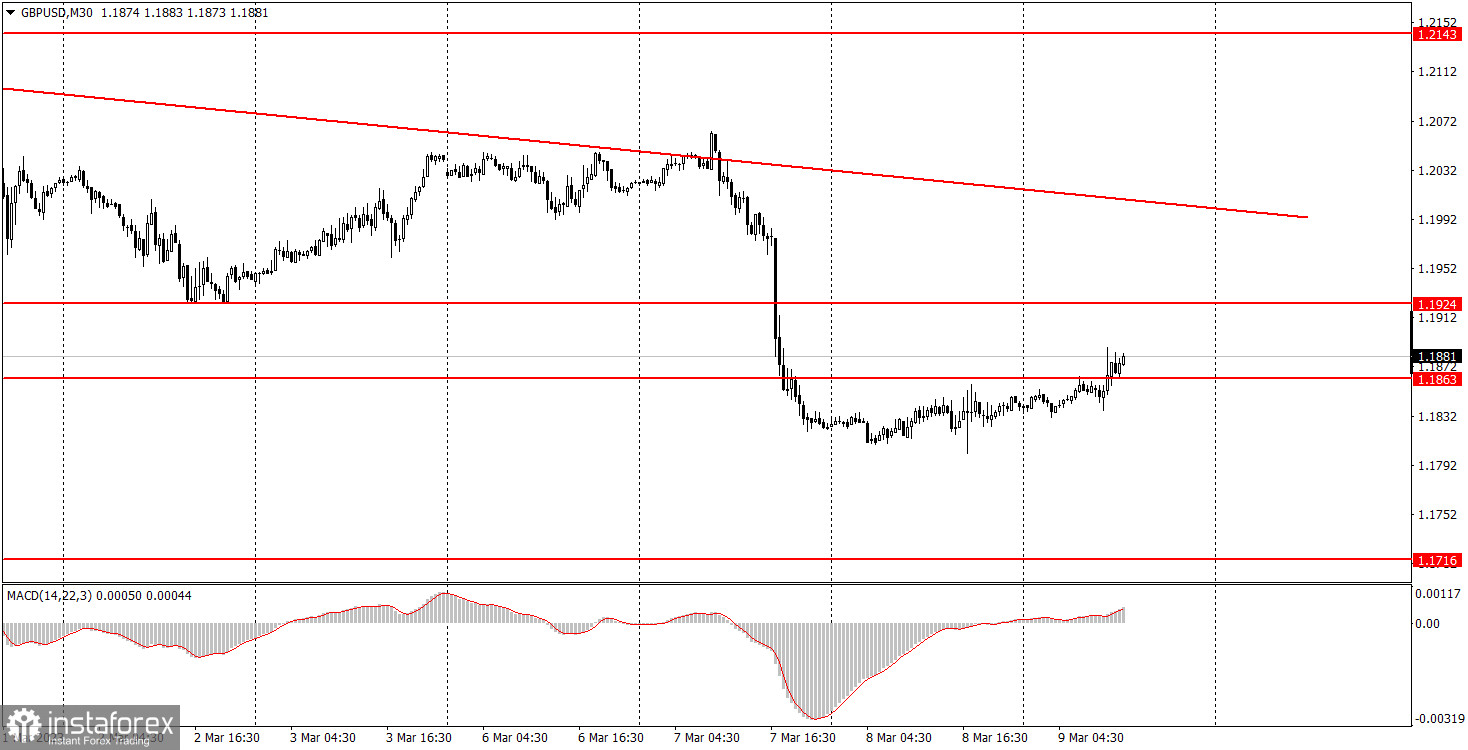
30M chart of the GBP/USD pair.

On Wednesday, the GBP/USD pair started a wave of upward correction. Since the volatility in this instance was barely at zero, just a formal downward correction was necessary. Although we have created a formal trend line that perfectly captures the present trend, the price has already broken through it at least twice. As a result, it cannot be regarded as integral. Although the pound sterling is currently being adjusted to it, if growth continues at the current pace, the trend line will likely follow the price. Similar to yesterday, there are no significant events planned in the UK today. As a result, it is unnecessary to anticipate sudden moves. In the United States, an ADP report was released yesterday, which many compare to nonfarm payrolls. These two reports appear to reflect the same indicator of the state of the labor market, yet they virtually invariably show different values and trends. Yesterday, the market happily ignored it. As well as Jerome Powell's second congressional speech, because nothing new was said.
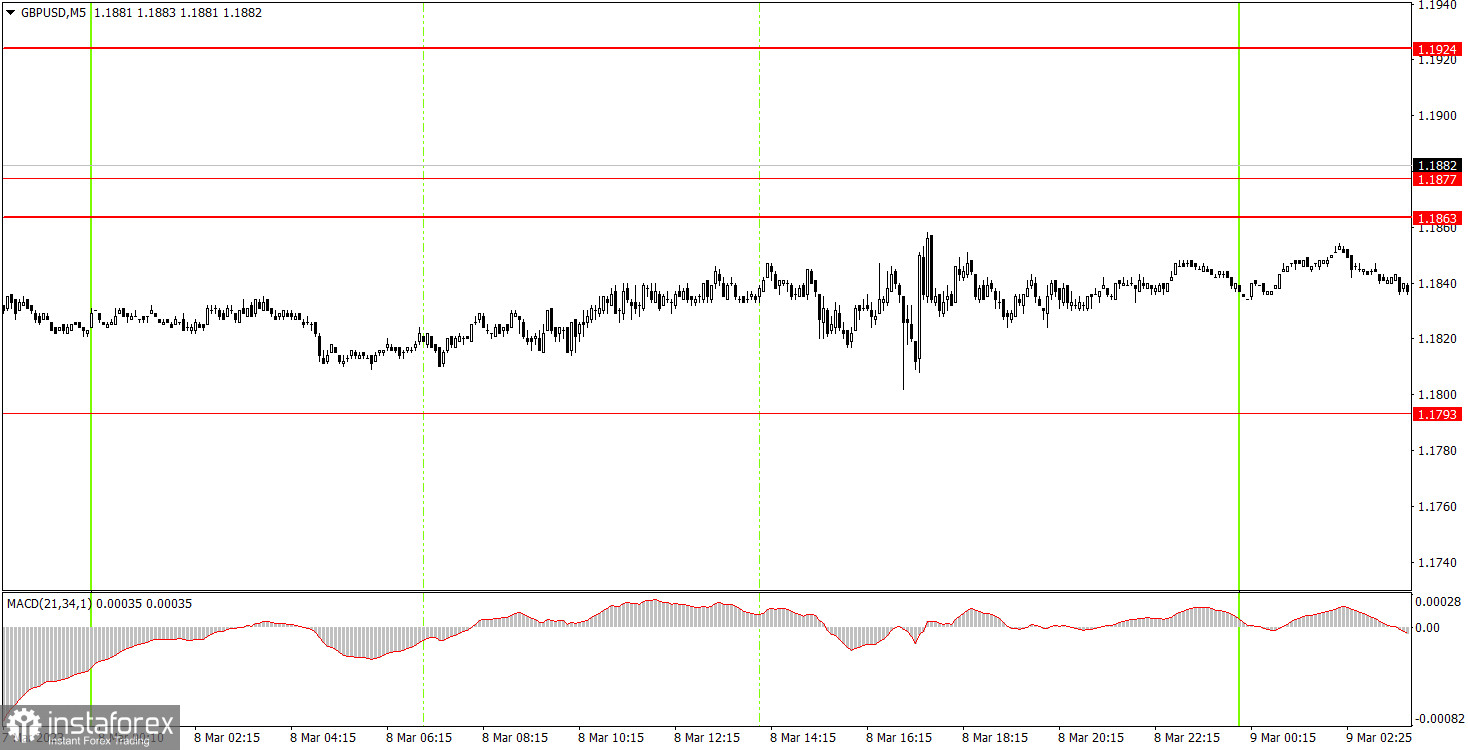
5M chart for the GBP/USD currency pair.

The environment's trading signals cannot be analyzed because they weren't present. The situation with the EUR/USD pair, where numerous identical signals were generated, is even better than this. The pair only came close to the levels where signals might form throughout the day twice, but they never managed to resolve any of them. The margin of error was too great in both the first and second cases for deals to be opened. The lack of trading signals is perfectly acceptable in this flat market.
Thursday trading strategies:
The pound/dollar pair finally broke out of the side channel on the 30-minute TF, allowing the downward trend to fully recover as we had anticipated for weeks. This week will have a few more intriguing events that could have a significant impact on the market. The calendar is empty today. We think that the market response will undoubtedly occur after Friday's nonfarm report. Tomorrow, you can trade at levels 1.1608, 1.1648, 1.1716, 1.1793, 1.1863–1.877, 1.1924, 1.1992–1.2008, 1.2065–1.2079, and 1.2143 on the 5-minute TF. 20 points can be set as a breakeven stop loss when the price advances after starting a deal in the proper direction. There are no noteworthy events or reports scheduled for Thursday in the United Kingdom or the United States. In the United States, applications for unemployment benefits are not taken into account. The movement may theoretically intensify throughout the American trading day, but there is no reason to expect this to happen.
The following are the fundamental guidelines for the trading system:
1) The strength of the signal is determined by the amount of time it takes to develop the signal (rebound or overcoming the level). The shorter the time, the stronger the signal.
2) If two or more trades were opened on false signals near a given level, all subsequent signals from that level should be ignored.
3) On a flat, any pair can generate a large number of false signals or none at all. In any case, it is advisable to halt trading at the first indications of a flat.
4) Trades are opened between the start of the European session and the middle of the American session when all trades must be manually closed.
5) Only when there is strong volatility and a trend that is supported by a trend line or a trend channel can signals from the MACD indicator on a 30-minute TF be traded.
6) If two levels are positioned too near to each other (from 5 to 15 points), then they should be considered as a support or resistance area.
What's on the chart:
Price support and resistance levels are the levels that are the targets when opening purchases or sales. Take Profit levels may be positioned close by.
Red lines are channels or trend lines that represent the current trend and show in which direction it is preferred to trade today.
A histogram and a signal line, the MACD indicator (14, 22, 3) is an auxiliary indicator that can also be utilized as a signal source.
Major speeches and reports that are always on the news calendar can have a big impact on how a currency pair moves. As a result, it is advised that traders trade carefully during their exit or leave the market altogether to prevent a fast price reversal from the prior action.
Novice forex traders should keep in mind that not all transactions will be profitable. Long-term trading success is mostly dependent on developing a clear plan and practicing sound money management.
 English
 Русский
 Bahasa Indonesia
 Bahasa Malay
 ไทย
ไทย Español
 Deutsch
 Български
 Français
 Tiếng Việt
 中文
中文 বাংলা
বাংলা हिन्दी
 Čeština
 Українська
 Română

