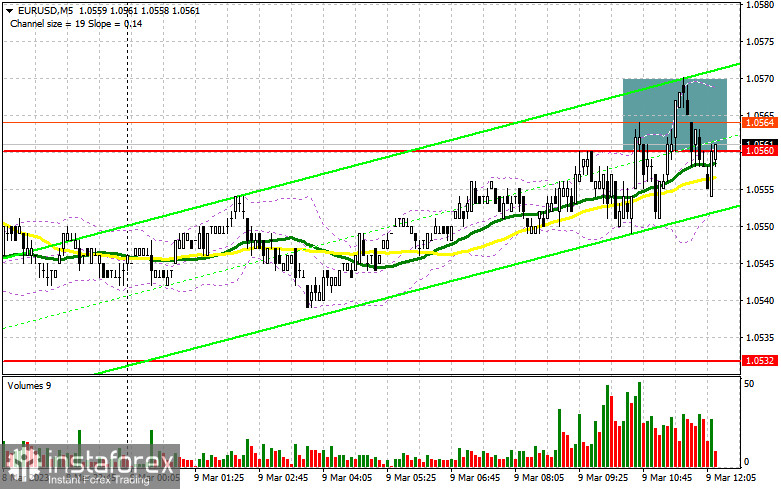
In my morning article, I turned your attention to 1.0560 and recommended making decisions with this level in focus. Now, let's look at the 5-minute chart and figure out what actually happened. An upward movement and false breakout of this level gave a sell signal. However, as seen on the chart, the euro has not dropped yet. The level itself has stopped being the key one. Therefore, I revised the technical outlook for the afternoon.

When to open long positions on EUR/USD:
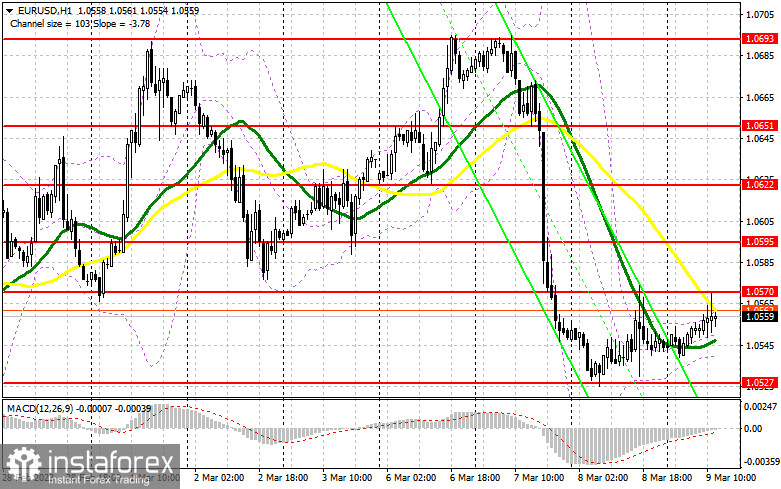
During the American session, The US will release a batch of labor market reports. However, the weekly data on initial jobless claims is unlikely to influence the trajectory of the pair. Investors will also ignore the speech of Michael S. Barr, who will hardly say anything new after Jerome Powell's comments. For this reason, EUR bulls have an opportunity to initiate an upward correction. However, I am not so optimistic about the further increase of the euro, especially before the release of the Nonfarm Payrolls report. Hence, it is better to open long positions after a decline and a false breakout of the weekly low of 1.0527. It could trigger a buy signal with the prospect of a rise to the resistance level of 1.0570, formed in the morning. A breakout and a downward test of this level amid weak data on the US labor market will generate an additional entry point into long positions with a jump to 1.0595. It will be hard for the bulls to push the par above this level. A breakout of 1.0595 will force bears to close their Stop Loss orders, giving a buy signal with the possibility of moving up to 1.0622. At this level, I recommend locking in profits. A test of this level will indicate the end of the bearish trend with the pair moving into a sideways channel. If EUR/USD declines and buyers show no activity at 1.0527 during the American session, which is also unlikely today, the pressure on the pair will return. A breakout of this level will lead to a fall to the support level of 1.0487. A false breakout there will create new entry points into long positions. You could buy EUR/USD at a bounce from 1.0451 or 1.0395, keeping in mind an upward intraday correction of 30-35 pips.
When to open short positions on EUR/USD:
Sellers are also sitting on the sidelines. They are waiting for NFP data to sell the pound sterling at a more favorable price. It is better to open short positions after a rise and a false breakout of the resistance level of 1.0570, similar to the one I have discussed above. It will generate new entry points with the likelihood of a drop to the weekly low of 1.0527. A breakout and an upward retest of this level amid strong US macro stats will provide a sell signal with a decline to 1.0487. It will facilitate the bearish bias. A decrease below this level will cause a more significant downward movement to 1.0451 where I recommend locking in profits. If EUR/USD rises during the American session and bears show no energy at 1.0570, which is more likely, I would advise you to postpone short positions until a false breakout of 1.0595. You could sell EUR/USD at a bounce from 1.0622, keeping in mind a downward intraday correction of 30-35 pips.

COT report
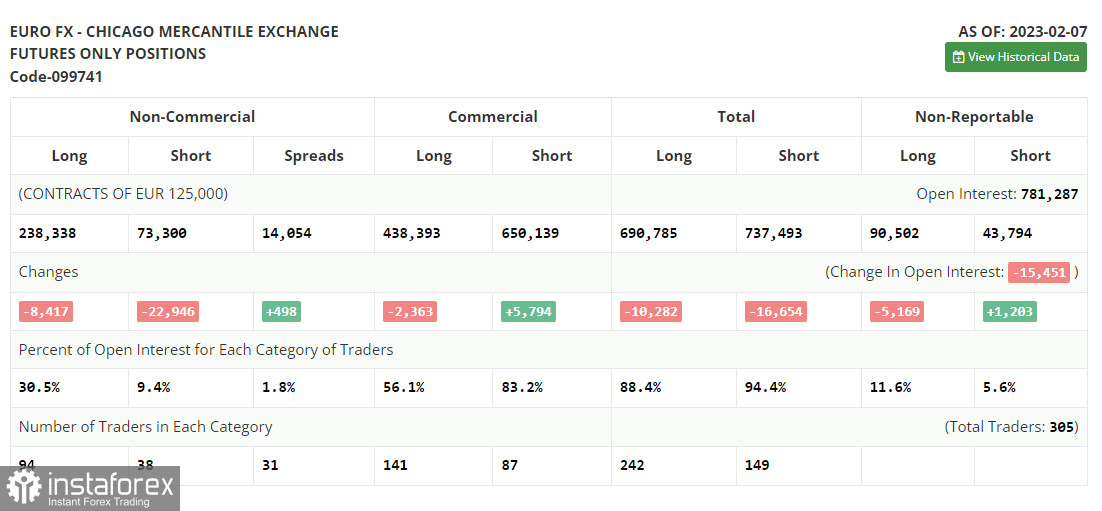
According to the COT report from February 7, the number of both long and short positions dropped. The COT report from February 7 logged a decrease in both long and short positions. This happened just after the Federal Reserve and the ECB announced their key rate decisions. In fact, the COT data from a month ago is of little interest at this point as it is not relevant due to the technical glitch the CFTC recently suffered. That is why we have to wait for fresh reports. In the near future, Fed Chair Jerome Powell will give testimony, which may determine the dollar's future trend for a month ahead. The FOMC meeting will take place at the end of March. Hawkish remarks about inflation and monetary policy will boost the US dollar against the euro. If Powell says nothing new on the matter, the greenback is likely to show weakness. According to the COT report, the number of long non-commercial positions decreased by 8,417 to 238,338. The number of short non-commercial positions slid by 22,946 to 73,300. Consequently, the non-commercial net position came in at 165,038 versus 150,509. The weekly closing price fell to 1.0742 from 1.0893.

Indicators' signals:
Trading is carried out near the 30 and 50 daily moving averages, which indicates sideways movement.
Moving averages
Note: The period and prices of moving averages are considered by the author on the H1 (1-hour) chart and differ from the general definition of the classic daily moving averages on the daily D1 chart.
Bollinger Bands
If EUR/USD rises, the indicator's upper border at 1.0570 will serve as resistance.
Description of indicators
- Moving average (moving average, determines the current trend by smoothing out volatility and noise). Period 50. It is marked yellow on the chart.
- Moving average (moving average, determines the current trend by smoothing out volatility and noise). Period 30. It is marked green on the chart.
- MACD indicator (Moving Average Convergence/Divergence - convergence/divergence of moving averages) Quick EMA period 12. Slow EMA period to 26. SMA period 9
- Bollinger Bands (Bollinger Bands). Period 20
- Non-commercial speculative traders, such as individual traders, hedge funds, and large institutions that use the futures market for speculative purposes and meet certain requirements.
- Long non-commercial positions represent the total long open position of non-commercial traders.
- Short non-commercial positions represent the total short open position of non-commercial traders.
- Total non-commercial net position is the difference between the short and long positions of non-commercial traders.
 English
 Русский
 Bahasa Indonesia
 Bahasa Malay
 ไทย
ไทย Español
 Deutsch
 Български
 Français
 Tiếng Việt
 中文
中文 বাংলা
বাংলা हिन्दी
 Čeština
 Українська
 Română

