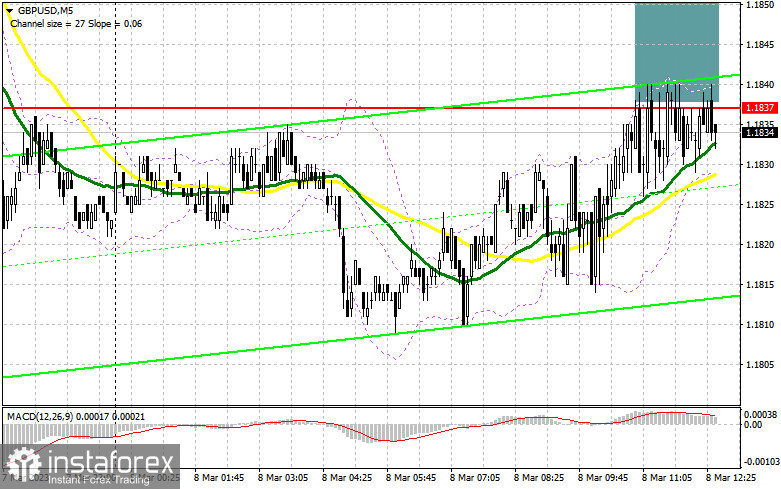
In my morning forecast, I highlighted the level of 1.1837 and recommended to make market entry decisions with this level in mind. Let us have a look at the 5-minute chart and see what happened. GBP/USD increased and performed a false breakout of 1.1837. However, the resulting sell signal did not lead to a major downside movement. Because of this, the technical outlook for the second half of the day was slightly revised. Traders should pay close attention to it.

When to open long positions on GBP/USD:
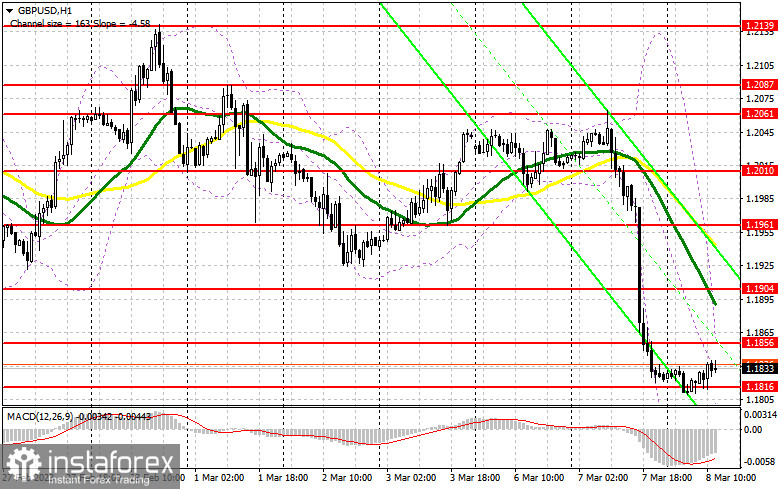
Strong US labor market data will surely push the pound sterling downward again, which explains the lack of bullish traders around 1.1837. An important goal for bulls in the second half of the day will be to hold onto the new support level at 1.1816, which was formed in the morning. If the pair drops to it and performs a false breakout on strong US statistic data, it would create an excellent entry point for long positions. Then, the pound sterling could make another attempt to test the new resistance level at 1.1856. GBP/USD would only move towards the new high at 1.1904 if it settles above the resistance and performs a downward retest. At 1.1904 lie the moving averages, which support bearish traders. If the pair moves above this range, it could increase to 1.1961, where I am going to take profit. A test of this area will also indicate that the buyers are returning to the market. If bulls are unable to hold on to 1.1816, which is very likely, their situation will be much more difficult. Yesterday, bears successfully took control of the market, and another sell-off only requires a trigger event. In this scenario, long positions should be opened only if GBP/USD performs a false breakout of the low at 1.1785. I would buy GBP/USD immediately if it bounces off the low at 1.1745, targeting an intraday correction of 30-35 pips.
When to open short positions on GBP/USD:
Bearish traders were active near 1.1837, but their efforts were not strong enough. Now the best course of action is to wait for the reaction to Powell's speech and the US labor market data. If the pound sterling jumps, I will await for a false breakout of 1.1856, just like during morning trading. It will create an entry signal, pushing GBP/USD down to the support area of 1.1816. A break-down and an upward test of that range will increase downside pressure on the pound sterling, which will lead to a new major sell-off and push the pair to 1.1785. The most distant target will be 1.1747 area, where I will take profits. If GBP/USD rises and bears are idle at 1.1856, which is unlikely, the situation will stabilize. In that case the bears will withdraw and only a false breakout of the next resistance level of 1.1904 will form an entry point for short positions. If there is no activity there as well, I will sell GBP/USD if it bounces off the high at 1.1961, expecting an intraday pullback of 30-35 pips.
Commitment of Traders (COT) report:
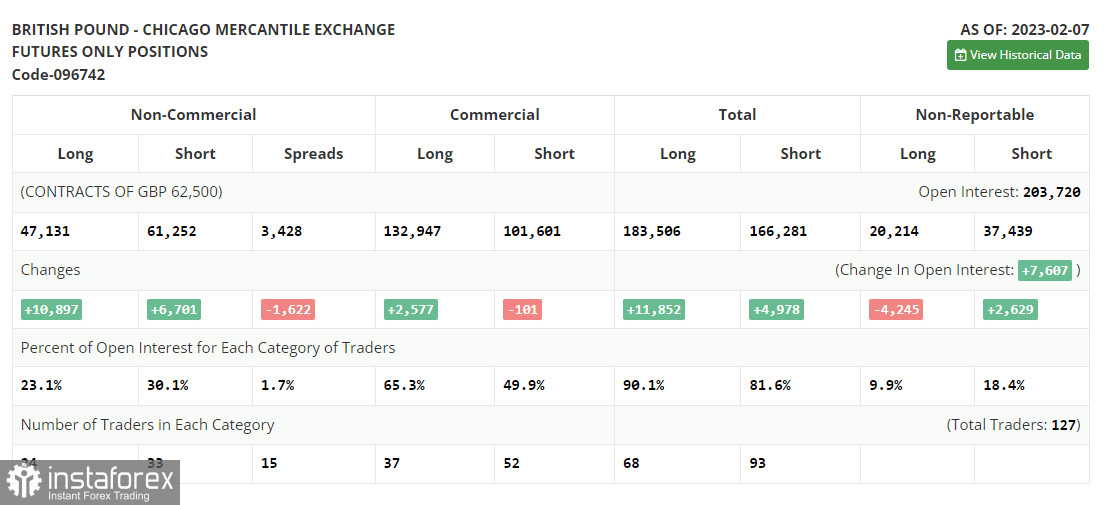
The Commitment of Traders (COT) report for February 7 marked an increase in both long and short positions. Obviously, traders were satisfied with further plans of the Bank of England. As a result, traders increased their long positioning. However, some of them decided to take advantage of the moment and sell GBP during its uptrend, anticipating further aggressive moves by the Fed this year. This week, there are no important fundamental data from the UK aside from a couple of reports, so the pressure on risky assets might slightly weaken. Theoretically, it may result in an upward correction of GBP/USD. The key factor would be the remarks by Fed chairman Jerome Powell as he prepares the markets for the policy meeting at the end of March. The latest COT report showed that short non-commercial positions rose by 6,701 to 61,252, while long non-commercial positions grew by 10,897 to 47,131, bringing the negative non-commercial net position down to -14,121 from -18,317 a week earlier. The weekly closing price declined to 1.2041 from 1.2333.

Indicators' signals:
Moving averages
Trading is carried out below 30-day and 50-day moving averages, which indicates that the pair may continue to decline.
Note: The period and prices of moving averages are considered by the author on the H1 (1-hour) chart and differ from the general definition of the classic daily moving averages on the daily D1 chart.
Bollinger Bands
If GBP/USD moves down, the indicator's lower border at 1.1815 will serve as support.
Description of indicators
Moving average (moving average, determines the current trend by smoothing out volatility and noise). Period 50. It is marked yellow on the chart. Moving average (moving average, determines the current trend by smoothing out volatility and noise). Period 30. It is marked green on the chart. MACD indicator (Moving Average Convergence/Divergence - convergence/divergence of moving averages) Quick EMA period 12. Slow EMA period to 26. SMA period 9 Bollinger Bands (Bollinger Bands). Period 20 Non-commercial speculative traders, such as individual traders, hedge funds, and large institutions that use the futures market for speculative purposes and meet certain requirements. Long non-commercial positions represent the total long open position of non-commercial traders. Short non-commercial positions represent the total short open position of non-commercial traders. Total non-commercial net position is the difference between the short and long positions of non-commercial traders. English
 Русский
 Bahasa Indonesia
 Bahasa Malay
 ไทย
ไทย Español
 Deutsch
 Български
 Français
 Tiếng Việt
 中文
中文 বাংলা
বাংলা हिन्दी
 Čeština
 Українська
 Română

