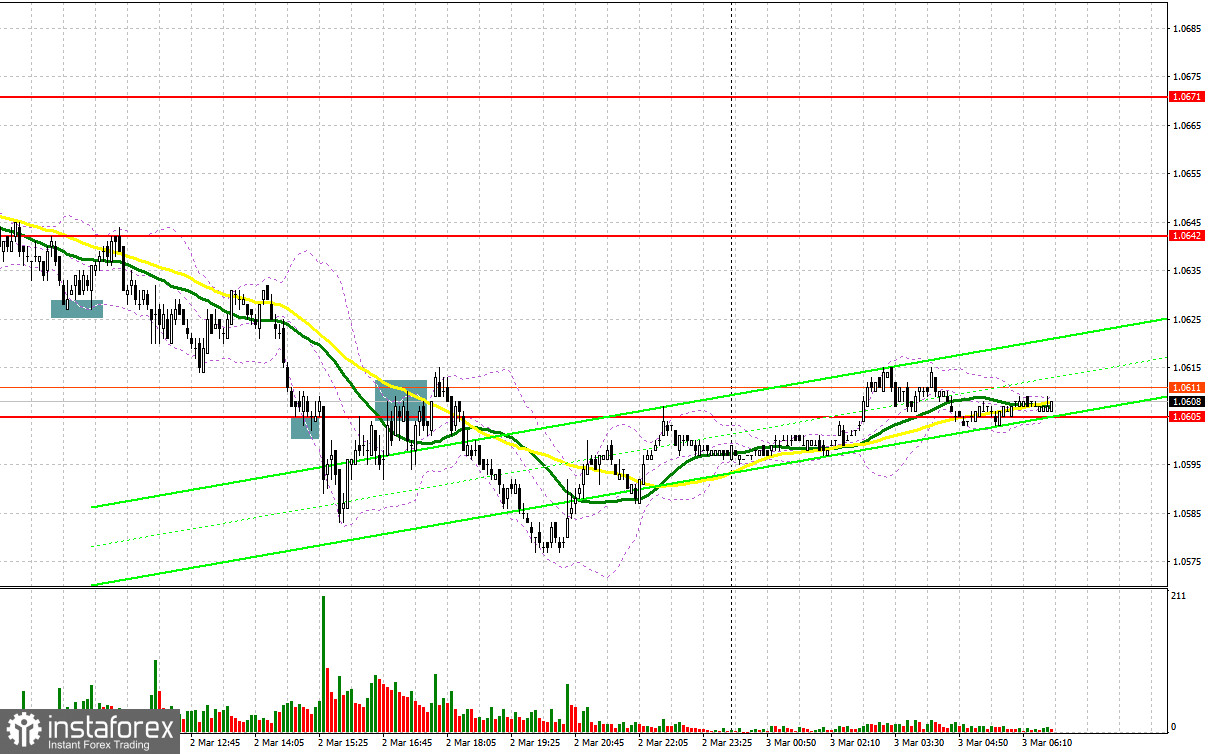
Yesterday, there were several entry points. Now, let's look at the 5-minute chart and figure out what actually happened. In my morning article, I turned your attention to 1.0628 and recommended making decisions with this level in focus. A decline and a false breakout of this level led to a buy signal within the upward trend. Yet, after a 15-pip rise, the pressure on the pair increased. In the afternoon, traders open long positions at 1.0605. However, they had to close Stop Loss orders as the pair did not climb higher. A breakout and downward retest of 1.0605 by the middle of the American session gave a sell signal. The downward movement totaled about 30 pips.

When to open long positions on EUR/USD:
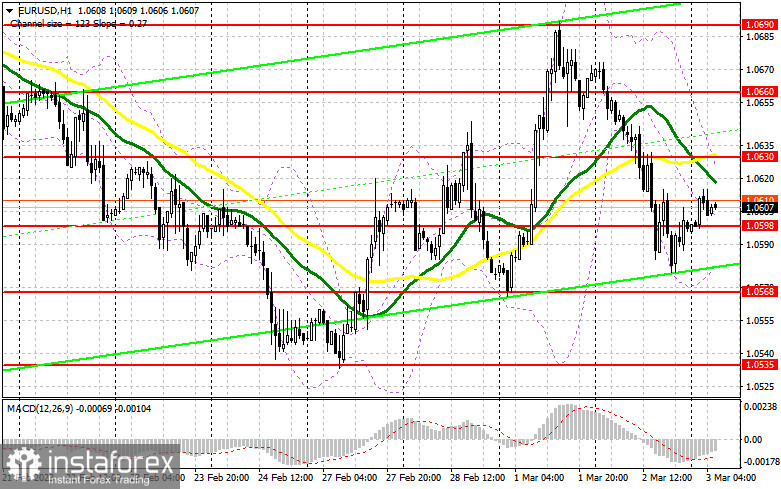
Bulls have a great chance to start a correction at the end of this week after a sell-off that occurred yesterday. Traders are now looking forward to the Euro Area Services PMI Index. Germany, France, and Italy will unveil the same reports. The figures for February are expected to be positive. This is why the euro may grow in the morning. Germany's trade balance data and the speech of the ECB policymaker Luis De Guindos are of little importance to speculators. If bears tighten their grip on the euro, pay attention to the support level of 1.0598, formed yesterday. The target of the recovery will be a new resistance of 1.0630. A breakout and a downward retest of 1.0662 amid the strong Services PMI data, will create additional entry points into long positions with a jump to 1.0660. It will be rather hard for the bulls to push the pair above this level. A breakout of 1.0660 will force the bears to close Stop Loss orders. It could trigger a bullish reversal, giving a buy signal with the prospect of a rise to 1.0690. At this level, I recommend locking in profits. If EUR/USD declines and buyers show no activity at 1.0598 in the morning, the pressure on the pair will return. A breakout of this level will lead to a fall to the support level of 1.0568 which the pair failed to reach yesterday. Only a false breakout there will give a buy signal. You could buy EUR/USD at a bounce from 1.0535 or 1.0487, keeping in mind an upward intraday correction of 30-35 pips.
When to open short positions on EUR/USD:
The sellers undermined the upward correction that started in the middle of the week. It means that demand for the US dollar remains strong. Thus, weak economic reports may cause a new drop in the euro/dollar pair. Given that strong data on the eurozone is expected, I would advise you to postpone short positions until the test and a false breakout of the resistance level of 1.0630. If so, the pair is likely to decrease to the support level of 1.0598. A breakout and an upward retest of this level will give new entry points into open short positions with a drop to 1.0568. It will stimulate the bearish sentiment. A decrease below this range will cause a more significant downward correction to 1.0535 where I recommend locking in profits. If EUR/USD rises during the European session and bears show no energy at 1.0630, I would advise you to postpone short positions until a false breakout of 1.0660. You could sell EUR/USD after a bounce from 1.0690, keeping in mind a downward intraday correction of 30-35 pips.

COT report
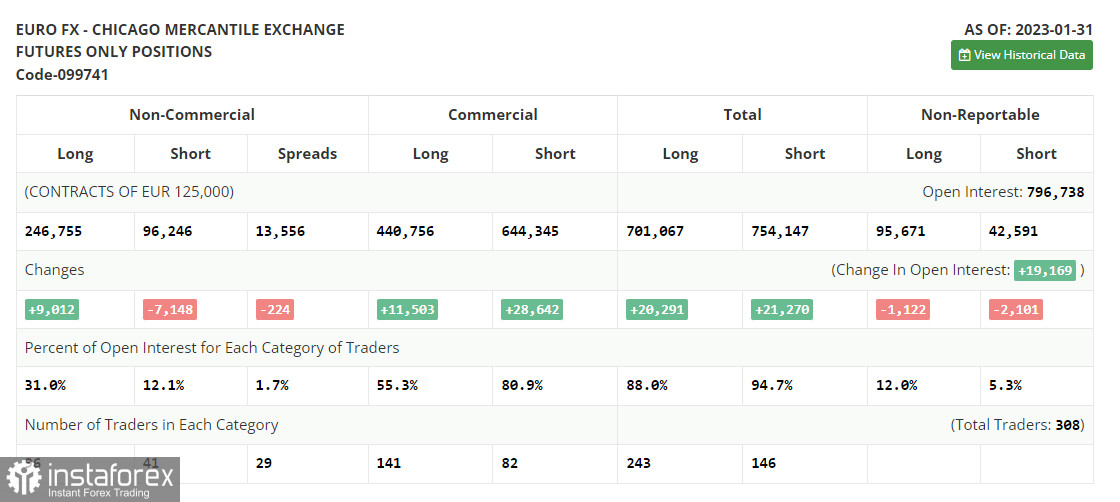
According to the COT report for January 31, the number of long positions increased, whereas the number of short ones dropped. It is obvious that this happened before the Federal Reserve and the European Central Bank announced their decisions on the key rates. In fact, the COT data from a month ago is of little interest now because of a technical problem in the CFTC that has been recently settled. This week is not rich in macroeconomic events. Therefore, the pressure on risk assets may ease somewhat, thus causing a correction in the euro/dollar pair. According to the COT report, the number of long non-commercial positions climbed by 9,012 to 246,755, whereas the number of short non-commercial positions dropped by 7,149 to 96,246. Consequently, the non-commercial net position came in at 150,509 versus 134,349. The weekly closing price fell to 1.0893 from 1.0919.

Indicators' signals:
Trading is carried out slightly below the 30 and 50 daily moving averages, which indicates market uncertainty.
Moving averages
Note: The period and prices of moving averages are considered by the author on the H1 (1-hour) chart and differ from the general definition of the classic daily moving averages on the daily D1 chart.
Bollinger Bands
If EUR/USD moves up, the indicator's upper border at 1.0625 will serve as resistance. In case of a decline, the indicator's lower border at 1.0580 will act as support.
- Description of indicators
- Moving average (moving average, determines the current trend by smoothing out volatility and noise). Period 50. It is marked yellow on the chart.
- Moving average (moving average, determines the current trend by smoothing out volatility and noise). Period 30. It is marked green on the chart.
- MACD indicator (Moving Average Convergence/Divergence - convergence/divergence of moving averages) Quick EMA period 12. Slow EMA period to 26. SMA period 9
- Bollinger Bands (Bollinger Bands). Period 20
- Non-commercial speculative traders, such as individual traders, hedge funds, and large institutions that use the futures market for speculative purposes and meet certain requirements.
- Long non-commercial positions represent the total long open position of non-commercial traders.
- Short non-commercial positions represent the total short open position of non-commercial traders.
- Total non-commercial net position is the difference between the short and long positions of non-commercial traders.
 English
 Русский
 Bahasa Indonesia
 Bahasa Malay
 ไทย
ไทย Español
 Deutsch
 Български
 Français
 Tiếng Việt
 中文
中文 বাংলা
বাংলা हिन्दी
 Čeština
 Українська
 Română

