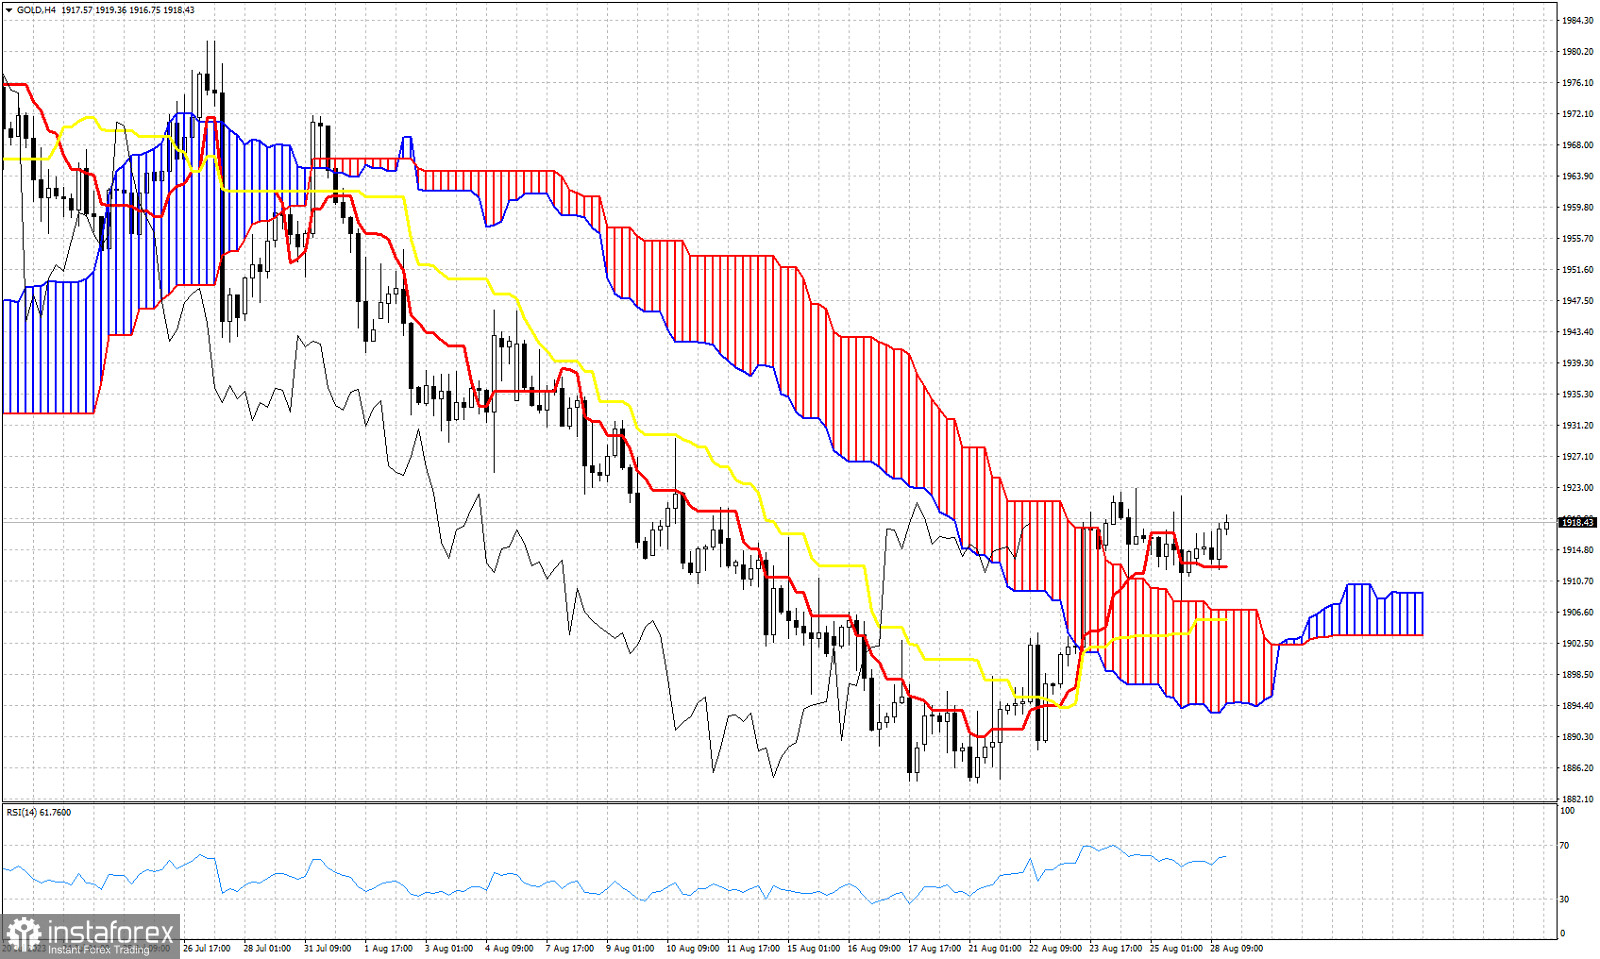
Gold price is in a bullish trend in the 4hour chart according to the Ichimoku cloud indicator. The bullish trend is valid as long as price holds above the Kumo (cloud). Support by the tenkan-sen (red line indicator) is at $1,912. The upper cloud boundary provides support at $1,906 and the kijun-sen (yellow line indicator) at $1,905. This $1,906-05 area is the most important support level. The Chikou span (black line indicator) is above the candlestick pattern (bullish). As we explained in previous posts, Gold justified a bounce higher as it was short-term oversold. According to the Ichimoku cloud indicator in the 4 hour chart, Gold can continue moving higher as long as price continues to trade above $1,905.
 English
 Русский
 Bahasa Indonesia
 Bahasa Malay
 ไทย
ไทย Español
 Deutsch
 Български
 Français
 Tiếng Việt
 中文
中文 বাংলা
বাংলা हिन्दी
 Čeština
 Українська
 Română

