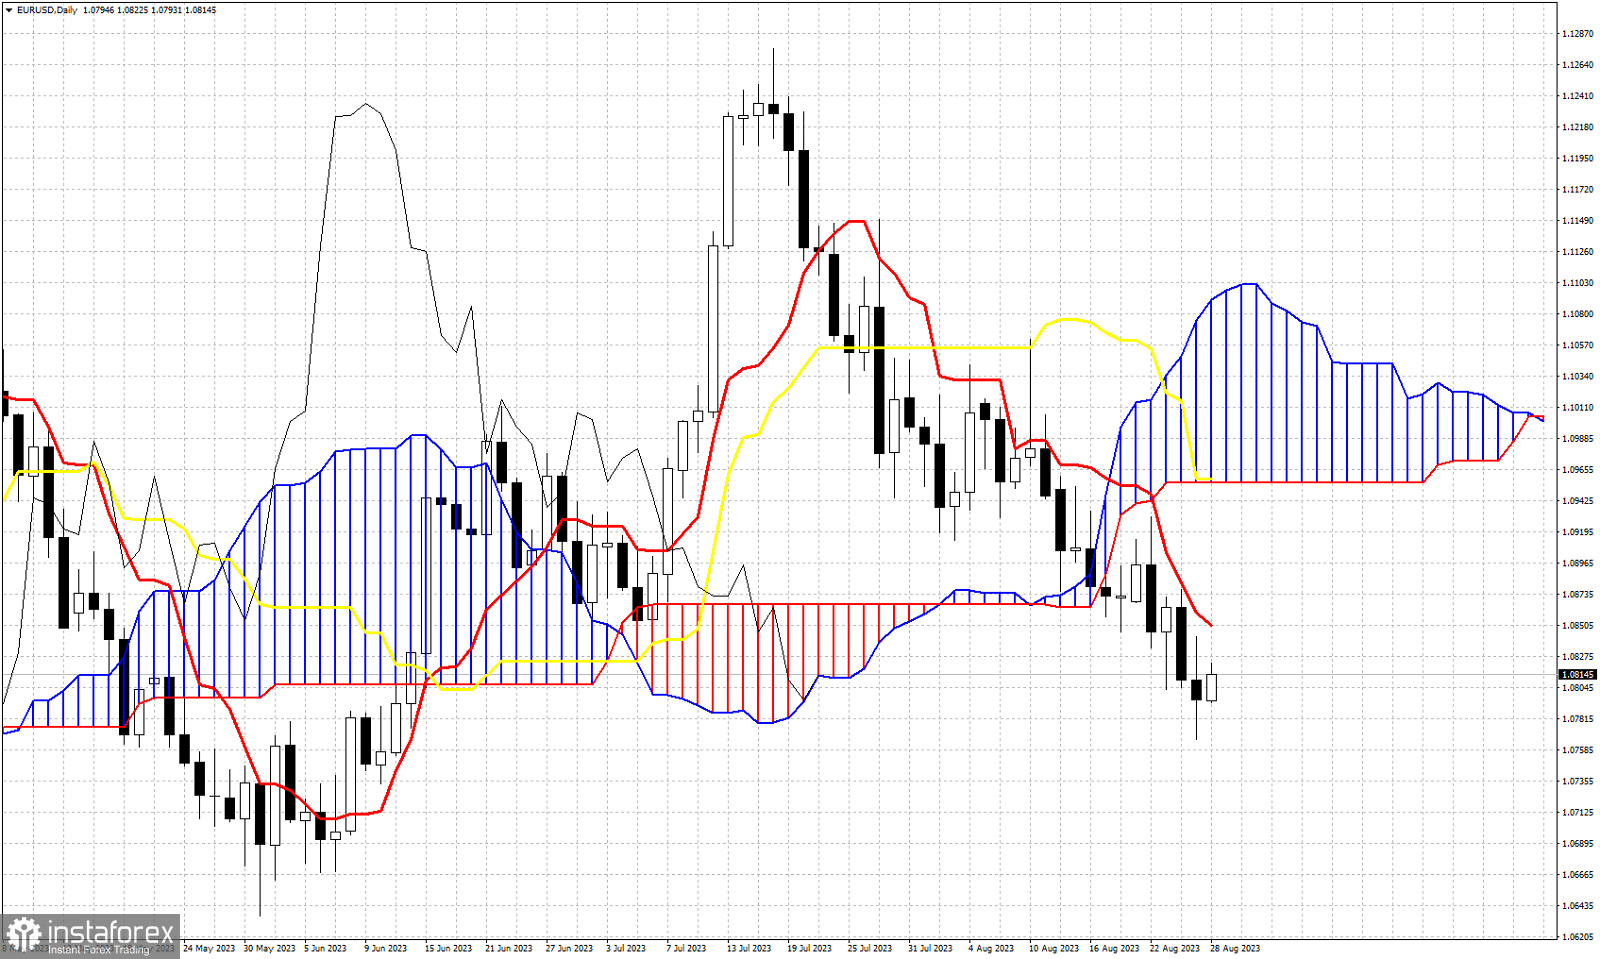
EURUSD is trading around 1.0805. In the Daily chart trend is bearish according to the Ichimoku cloud indicator. Price is below the tenkan-sen (red line indicator) which is the first important resistance at 1.0850. In the near term EURUSD is oversold and a bounce towards the tenkan-sen is justified. A break above 1.0850 could lead towards the kijun-sen (yellow line indicator) and the lower cloud boundary at 1.0955. A back test of the cloud from below is common after break below the cloud. The Chikou span (black line indicator) remains below the candlestick pattern (bearish). In the 4 hour chart trend remains bearish according to the Ichimoku cloud indicator and so far there is no sign of a reversal.
 English
 Русский
 Bahasa Indonesia
 Bahasa Malay
 ไทย
ไทย Español
 Deutsch
 Български
 Français
 Tiếng Việt
 中文
中文 বাংলা
বাংলা हिन्दी
 Čeština
 Українська
 Română

