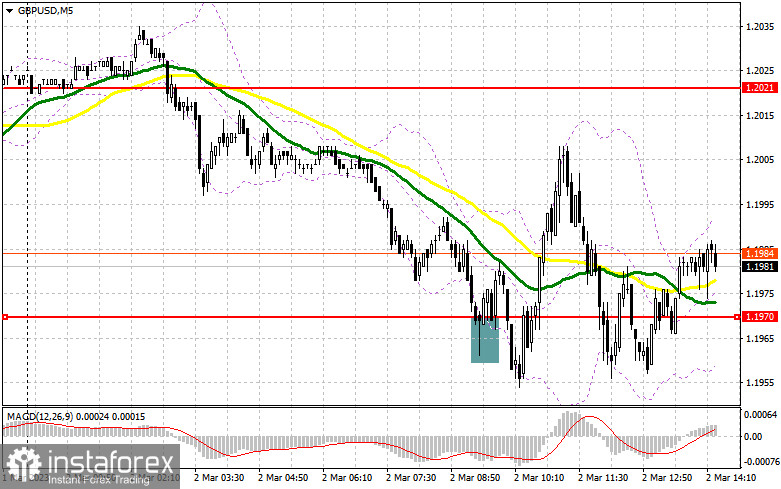
I focused on the 1.1970 level in my morning forecast and advised using it to make trading decisions. Let's take a look at the 5-minute chart and see what happened. The decrease and formation of a false breakout at this level provided a buy signal for the pound, but no significant upward movement followed. The technical picture was changed in the afternoon.

You require the following to open long positions on the GBP/USD:
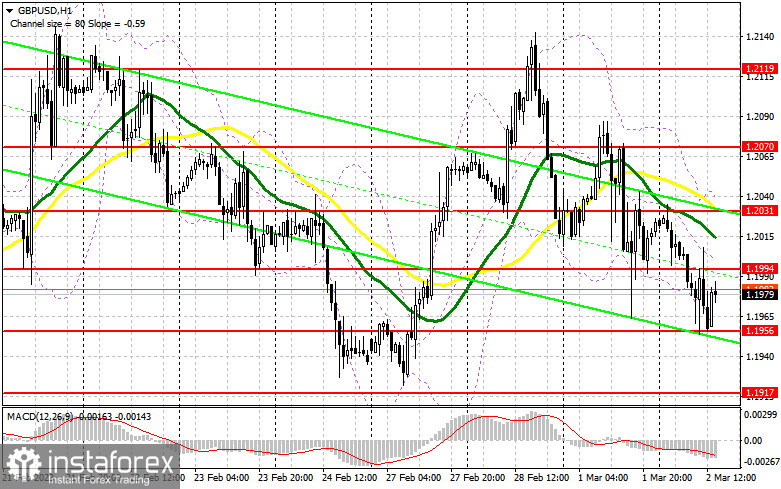
Given that we will be awaiting news on the US labor market throughout the American session, which should cause volatility, I will attempt to concentrate on the nearest support level of 1.1956, which was created by the result of the first half of the day. Only a false collapse at 1.1956 will provide an excellent entry point to purchase with the possibility of a breakout to 1.1994 - a new intermediate resistance set during the European session. I will wager on the movement of the GBP/USD up to the high of 1.2031, where the moving averages are playing on the side of the bulls when fixing and testing this range from top to bottom against the backdrop of negative US data. A retreat above this level will also bring growth opportunities to 1.2070, where I've fixed profits. A test of this area will likewise show that the buyers' market has returned. Things will only get worse if the bulls are unable to handle the tasks and miss 1.1956, which is highly possible. In this instance, I urge you not to rush into purchases and to build long positions only around the past month's low of 1.1917 and only on a false collapse. As soon as the price rises over the 1.1875 minimum, I will buy GBP/USD with the intention of a 30- to 35-point correction during the day.
For opening short positions on the GBP/USD, you will need:
The tasks assigned to sellers during the first half of the day have been completed, and they have already updated the weekly minimum. The development of a false breakout in the area of intermediate resistance at 1.1994 (which would indicate a signal to enter the market with the expectation of a decrease in the support area of 1.1956) would be the only time short positions would be considered if the pair suddenly rises higher in the afternoon following weak US statistics. Buyers' hopes for a correction will be dashed by a repeated exit to 1.1956 with a breakout and a bottom-up test, which will also result in a sell signal and a decline to 1.1917. The area of 1.1875 will be my furthest target, where I'll make a profit. The situation will stabilize with the possibility of GBP/USD growth and the lack of bears at 1.1994; the bulls will then attempt to enter the market for equilibrium by the end of the week. In this scenario, the bears will pull back, and an entry point into short positions will only come from a false breakout at the next resistance level of 1.2031. In the absence of action, I will sell GBP/USD immediately from the high of 1.2070, but only if the pair falls by 30-35 points within the day.


Signals from indicators
Moving Averages
The fact that trading is taking place below the 30 and 50-day moving averages shows that the market is bearish.
Notably, the author considers the time and prices of moving averages on the hourly chart H1 and departs from the standard definition of the traditional daily moving averages on the daily chart D1.
Bands by Bollinger
The indicator's upper limit, which is located at 1.2030, will serve as resistance in the event of growth.
Description of indicators
- Moving average (moving average determines the current trend by smoothing out volatility and noise). Period 50. The graph is marked in yellow.
- Moving average (moving average determines the current trend by smoothing out volatility and noise). Period 30. The graph is marked in green.
- MACD indicator (Moving Average Convergence / Divergence - moving average convergence/divergence) Fast EMA period 12. Slow EMA period 26. SMA period 9
- Bollinger Bands (Bollinger Bands). Period 20
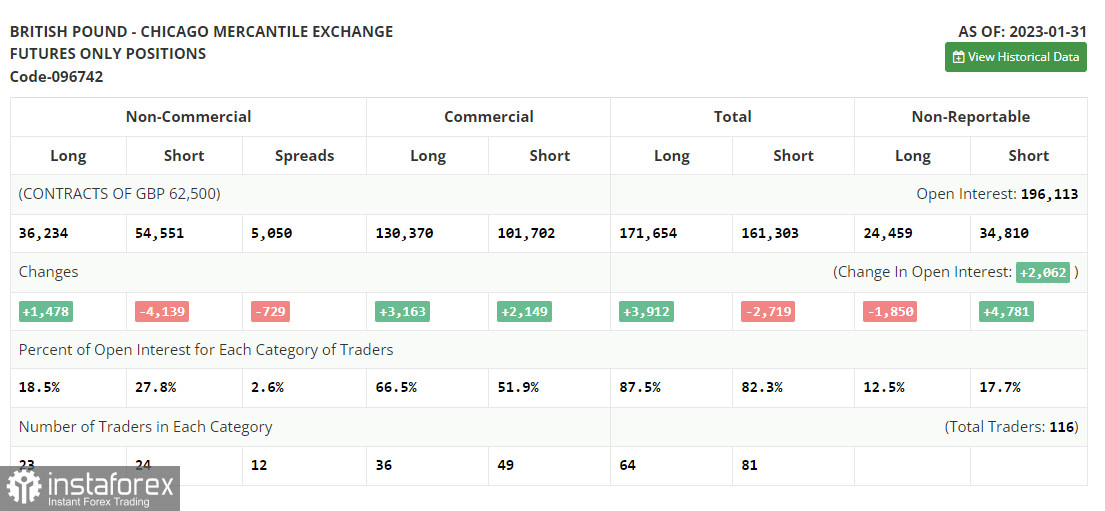
- Non-profit speculative traders, such as individual traders, hedge funds, and large institutions, use the futures market for speculative purposes and to meet certain requirements.
- Long non-commercial positions represent the total long open position of non-commercial traders.
- Short non-commercial positions represent the total short open position of non-commercial traders.
- Total non-commercial net position is the difference between the short and long positions of non-commercial traders.
 English
 Русский
 Bahasa Indonesia
 Bahasa Malay
 ไทย
ไทย Español
 Deutsch
 Български
 Français
 Tiếng Việt
 中文
中文 বাংলা
বাংলা हिन्दी
 Čeština
 Українська
 Română

