Judging by the time when the pound sterling started falling and events that took place at that time, we may say that it was Andrew Bailey's speech that spurred a drop in the currency. The governor of the Bank of England provided comments devoted to the problems faced by ordinary people. Closer to the end of the speech, he said that the key interest rate hike was under consideration and a final decision had not been taken yet. Andrew Bailey also disclosed a new inflation forecast, which is not just optimistic, it is utopian. The UK regulator expects that by the end of the current year, inflation will drop below 4.0%. It means that the BoE hinted about a possible decline in the key rate as early as this year.
Today, the pound sterling is likely to go on falling amid the preliminary inflation figures from the eurozone. A further slowdown in consumer price growth will inevitably lead to a decrease in the euro, which will drag the British pound.
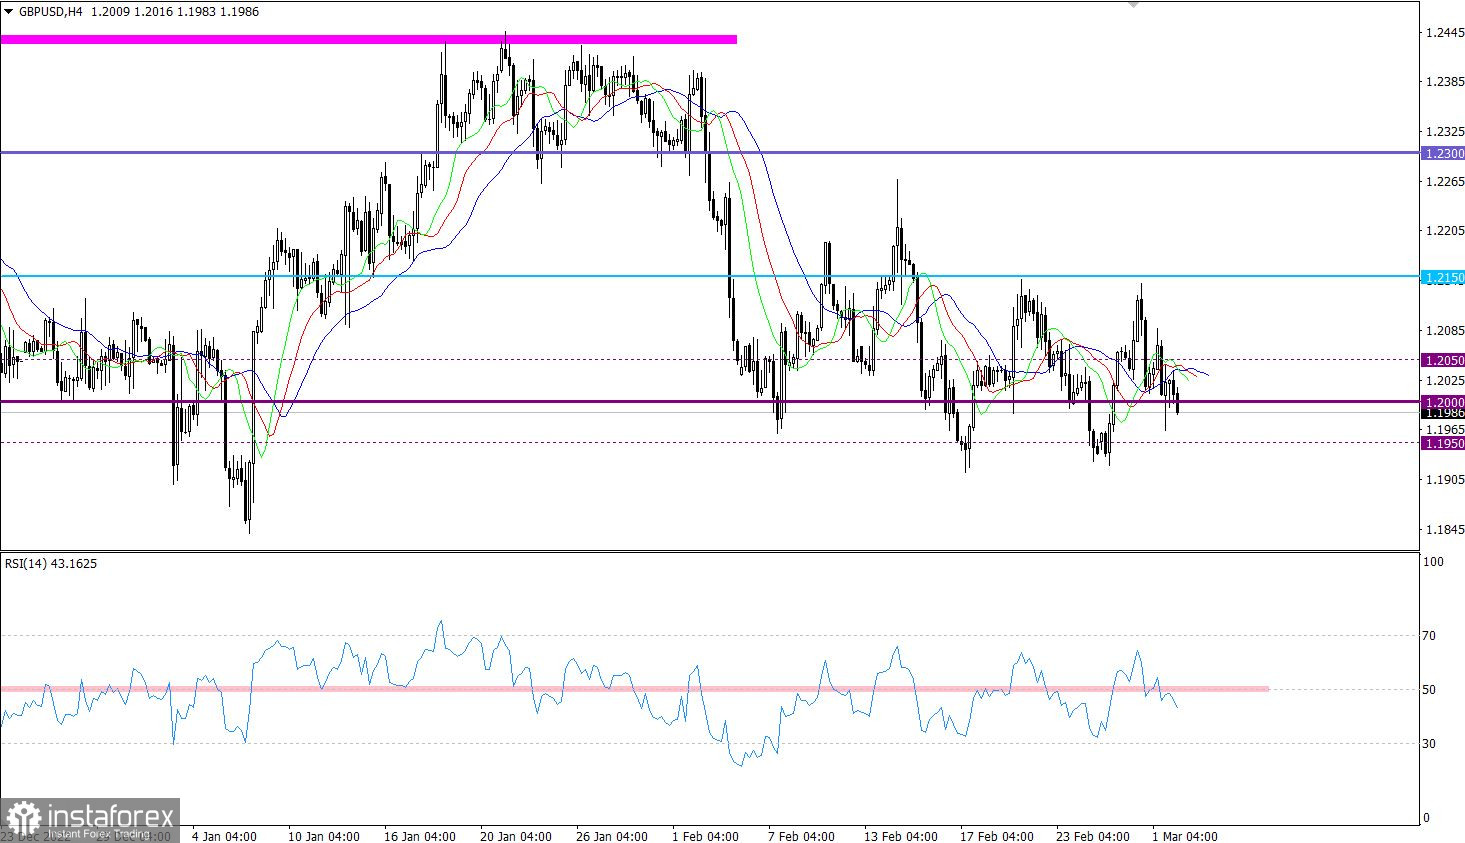
Yesterday, the pound sterling was in demand among speculators. At first, it jumped above 1.2050 and then slumped below 1.2000. Although the asset closed the trading day with the Doji candle pattern, the bearish sentiment remained in force.
On the four-hour chart, the RSI downwardly crossed the 50 middle line, thus reflecting bearish sentiment among traders.
On the same time frame, the Alligator's MAs are intersecting each other, which points to the intermediate signal.

Outlook
The pair has been moving along the psychological level of 1.2000 for more than two weeks. This points to the fact that both sellers and bulls remain focused on this level. Against the backdrop, the pair formed a sideways channel of 1.1950/1.2150.
If the price settles beyond either limit on the daily chart, traders will get a technical signal of the end of the flat movement. Until then, the pair will continue hovering within the range.
The complex indicator analysis unveiled that in the intraday and short-term periods, technical indicators are pointing to bearish sentiment since the asset is trading below 1.2000.
 English
 Русский
 Bahasa Indonesia
 Bahasa Malay
 ไทย
ไทย Español
 Deutsch
 Български
 Français
 Tiếng Việt
 中文
中文 বাংলা
বাংলা हिन्दी
 Čeština
 Українська
 Română

